Live · updated every minute

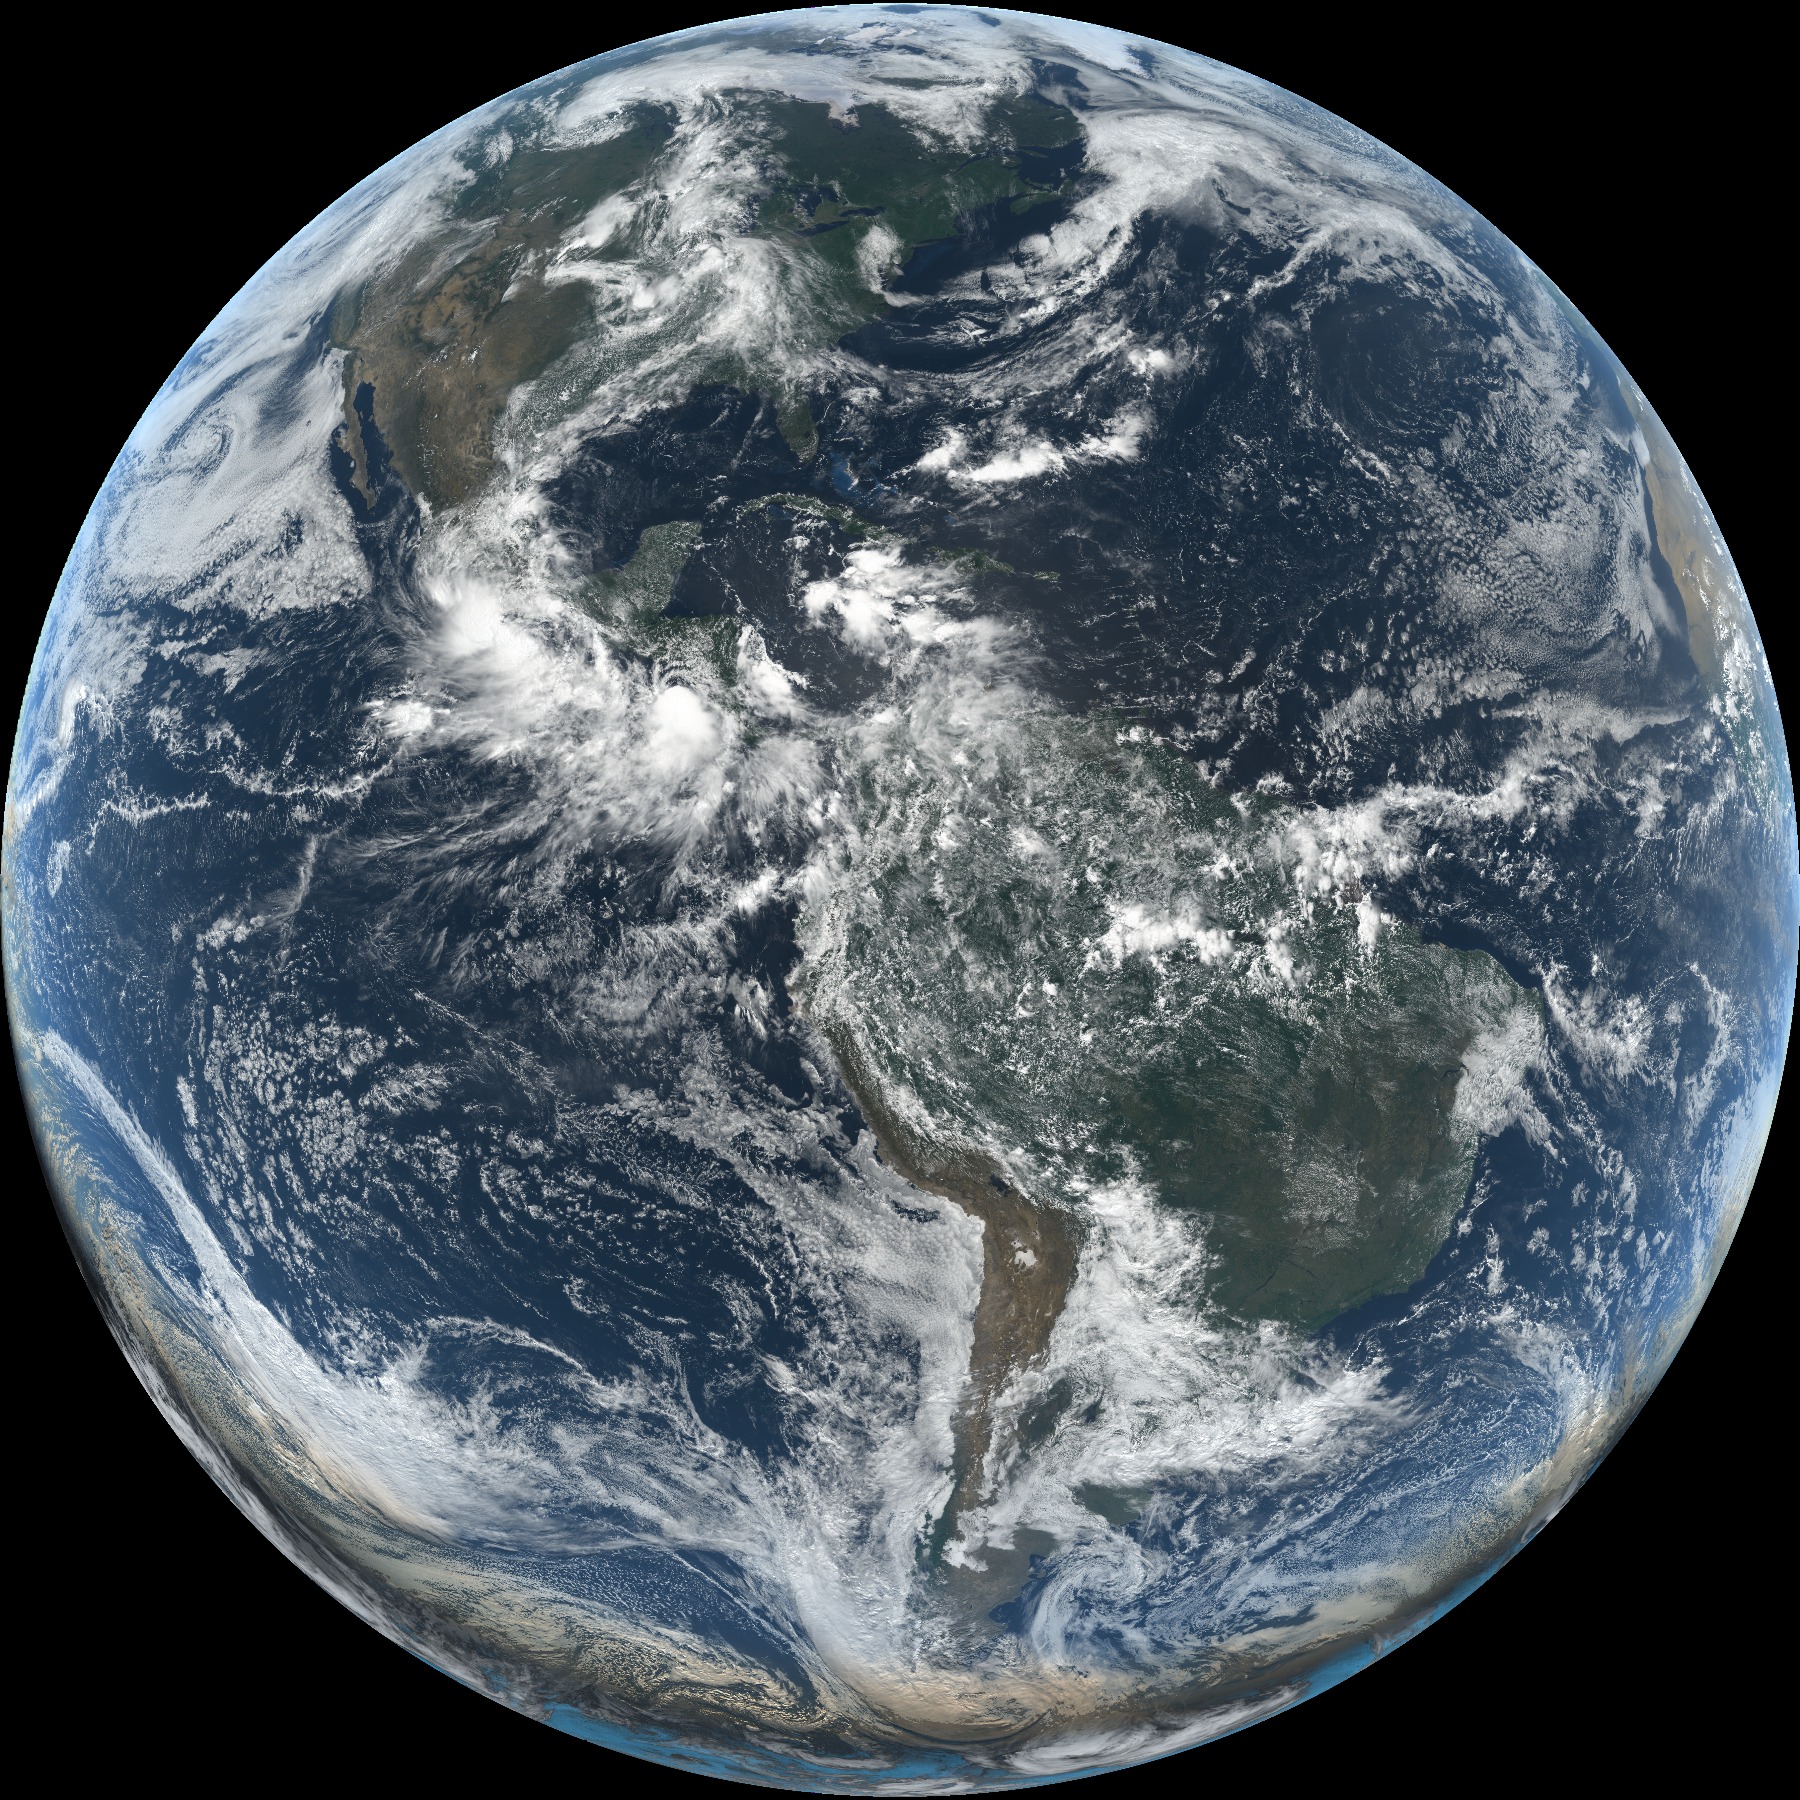
High Resolution Satellite Imagery, in real time.

The same GOES satellite imagery meteorologists use — radar, lightning, NWS warnings, and model overlays, from full-disk down to 1-minute mesoscale. Free to start.

Launch the Viewer Android Soon iOS Soon
No account needed to start · Free forever tier · Mobile apps coming soon
GOES full-disk satellite view
GOES-East & GOES-West MRMS radar GLM lightning NWS warnings SPC / WPC outlooks RTMA / RAP model fields 9 RGB composites & all 16 ABI channels Full Disk ~10 min CONUS ~5 min Regional sub-CONUS sector 1-minute mesoscale
See it in motion

Fast and sharp on any device

Imagery is pre-rendered on our servers and streamed to your device — smooth zoom and animation loops that stay sharp at every scale.

Layer the weather

Drop radar, lightning, warnings, and model fields right onto the imagery.

Zoom from disk to street

Pinch and pan from the full hemisphere down to your metro area.

Compare side by side

Dual- and quad-pane views, time-locked to the same frame.

Everything in one viewer

The full picture, in one place

Our backend calibrates all 16 ABI channels around the clock and layers real-time weather data on top — radar, lightning, warnings, and model fields.

🛰️

Every band, every domain

All 16 ABI channels plus 9 RGB composites — GeoColor, Sandwich, AirMass, Fire Temperature, Dust, and more — from hemispheric full-disk to 1-minute mesoscale.

⚠️

Severe weather, layered

NWS tornado, severe, and flash-flood warnings, SPC convective outlooks, WPC excessive-rainfall outlooks, and ProbSevere storm probabilities.

📡

Radar & lightning

MRMS multi-radar composite reflectivity overlaid on the image, plus GLM lightning straight from the satellite — flash points, density, and minimum flash area.

🌡️

Model & surface data

RTMA temperature, dewpoint and wind; RAP upper-air fields at five pressure levels; METAR station plots with standard symbology.

✏️

Analysis tools

Front drawing, pixel inspector with real channel values, distance measurement, time-series charting, and screenshot / animated-GIF export.

Favorites & sync

Save any combination of domain, product, overlays, and loop settings. A free account syncs them across web, iOS, and Android.

Built for analysis

Tools for real analysis

  • Draw & annotate — fronts, troughs, drylines, pressure centers, and text, included in every export.
  • Pixel inspector — read cloud-top brightness temperature in real units anywhere on the image.
  • Time-series chart — pin a point and track intensification, fire growth, or fog burn-off over the loop.
  • Distance & measure — km, miles, and nautical miles with domain-aware scaling.
  • Dual & quad pane — Sandwich + Clean IR + radar + lightning in one time-locked view.

Draw fronts & annotate

Time series — track a point over the loop

Coverage & cadence

From the whole hemisphere to your local area

Every product is generated across dozens of domains — and the fastest sectors refresh as quickly as the satellite scans.

10 min

Full Disk

Entire Western Hemisphere — hurricanes & large-scale patterns.

5 min

CONUS

The continental-US workhorse, all day, every day.

1 min

Mesoscale

NWS-targeted sectors aimed at active severe weather & fires.

Sub domains

Regional & local

Numerous regional to local sectors from the Full Disk and CONUS datasets.

Under the hood

Built on our servers, light on your device

The processing happens on our servers — your device just displays the result, fast even on older phones.

Calibrate

Raw GOES ABI data is pulled from NOAA's buckets and all 16 channels are calibrated to real radiances and brightness temperatures.

Composite & project

Numba-accelerated algorithms build RGB products and project everything onto regional Mercator grids — GeoColor day/night, AirMass, and more.

Layer & serve

Radar, lightning, warnings, and model fields are rasterized onto matching grids and written as ready-to-view images for web and mobile.

Plans & pricing

Start free. Upgrade to Pro anytime.

Every new account starts with a 14-day free trial of Pro — every domain, every channel, all overlays, radar, lightning, and the archive. Keep it for $19.99/year, or drop to Free anytime.

Free

$0 / forever
No account required to start
  • CONUS view
  • GeoColor + Channel 13 (Clean IR)
  • 6-frame loops
  • State & county boundaries
  • 1 saved favorite
Open the viewer
14-day free trial

Pro

$19.99 / year
or $1.99/month · save 16% yearly
  • Every domain — full disk, mesoscale, regional & local sub-domains
  • All 16 channels + every RGB composite
  • 50-frame loops
  • All overlays — radar, lightning, NWS, SPC, model & surface
  • Drawing, pixel inspector, time series
  • Archive — replay the last 48 hours
  • Unlimited favorites & cross-device sync
Start your free trial
Coming soon

Pro+

$49.99 / year
or $4.99/month
  • Everything in Pro
  • Forecast modeling — HRRR, GFS, ECMWF
  • Ensemble guidance
Get notified

14 days free, then your selected plan auto-renews until cancelled — cancel anytime. By subscribing you agree to our Terms and Privacy Policy.

Free account

Save your views. Sync everywhere.

Create a free account to save favorites and carry them across web, iOS, and Android. Sign in with a magic-link email, Google, or Apple — no separate registration step.

Ready to get started?

Launch the Viewer Android Soon iOS Soon
Weather safety notice. SatelliteWX is an informational and educational tool. Imagery, radar, lightning, model, and warning data come from third-party and government sources and may be delayed or incomplete. Always follow official National Weather Service warnings and local emergency guidance for decisions affecting safety of life or property.