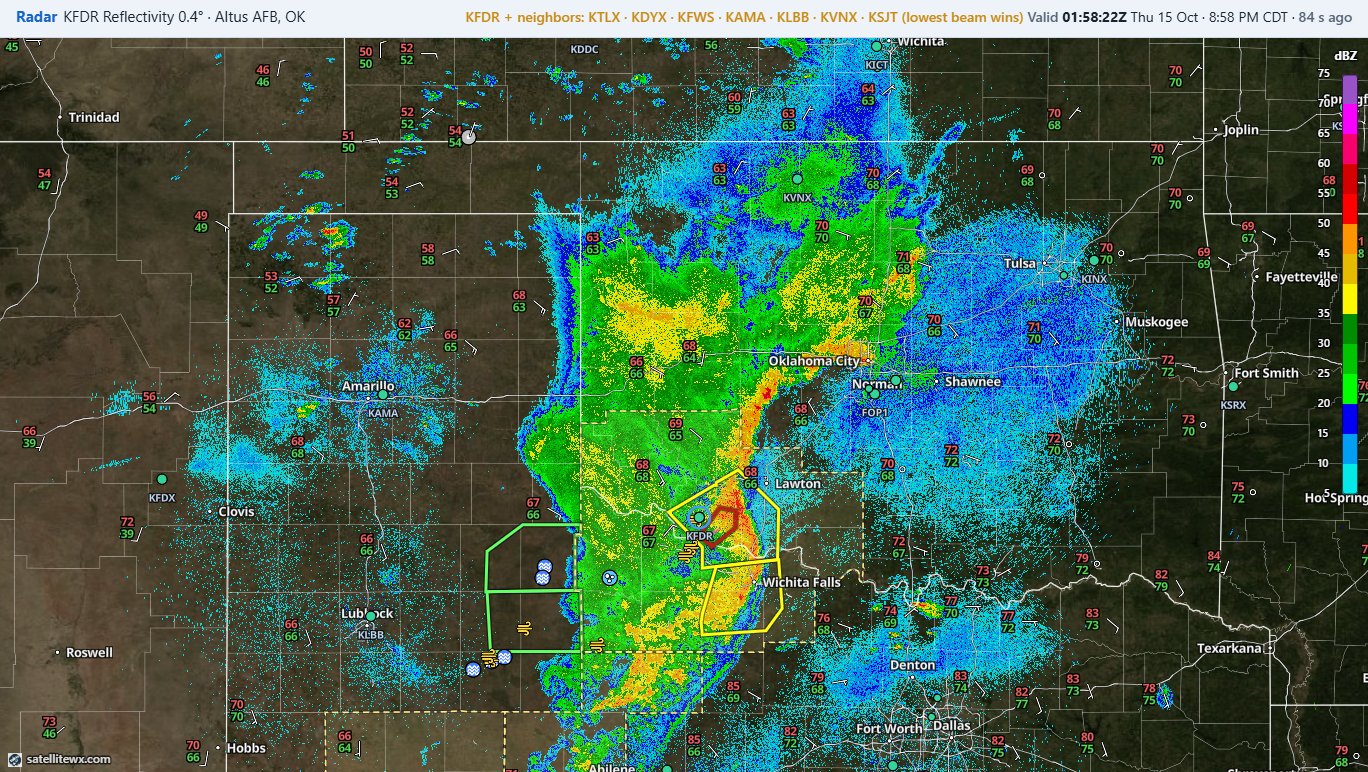
The same GOES satellite imagery meteorologists use — radar, lightning, NWS warnings, and model overlays, from full-disk down to 1-minute mesoscale. Free to start.
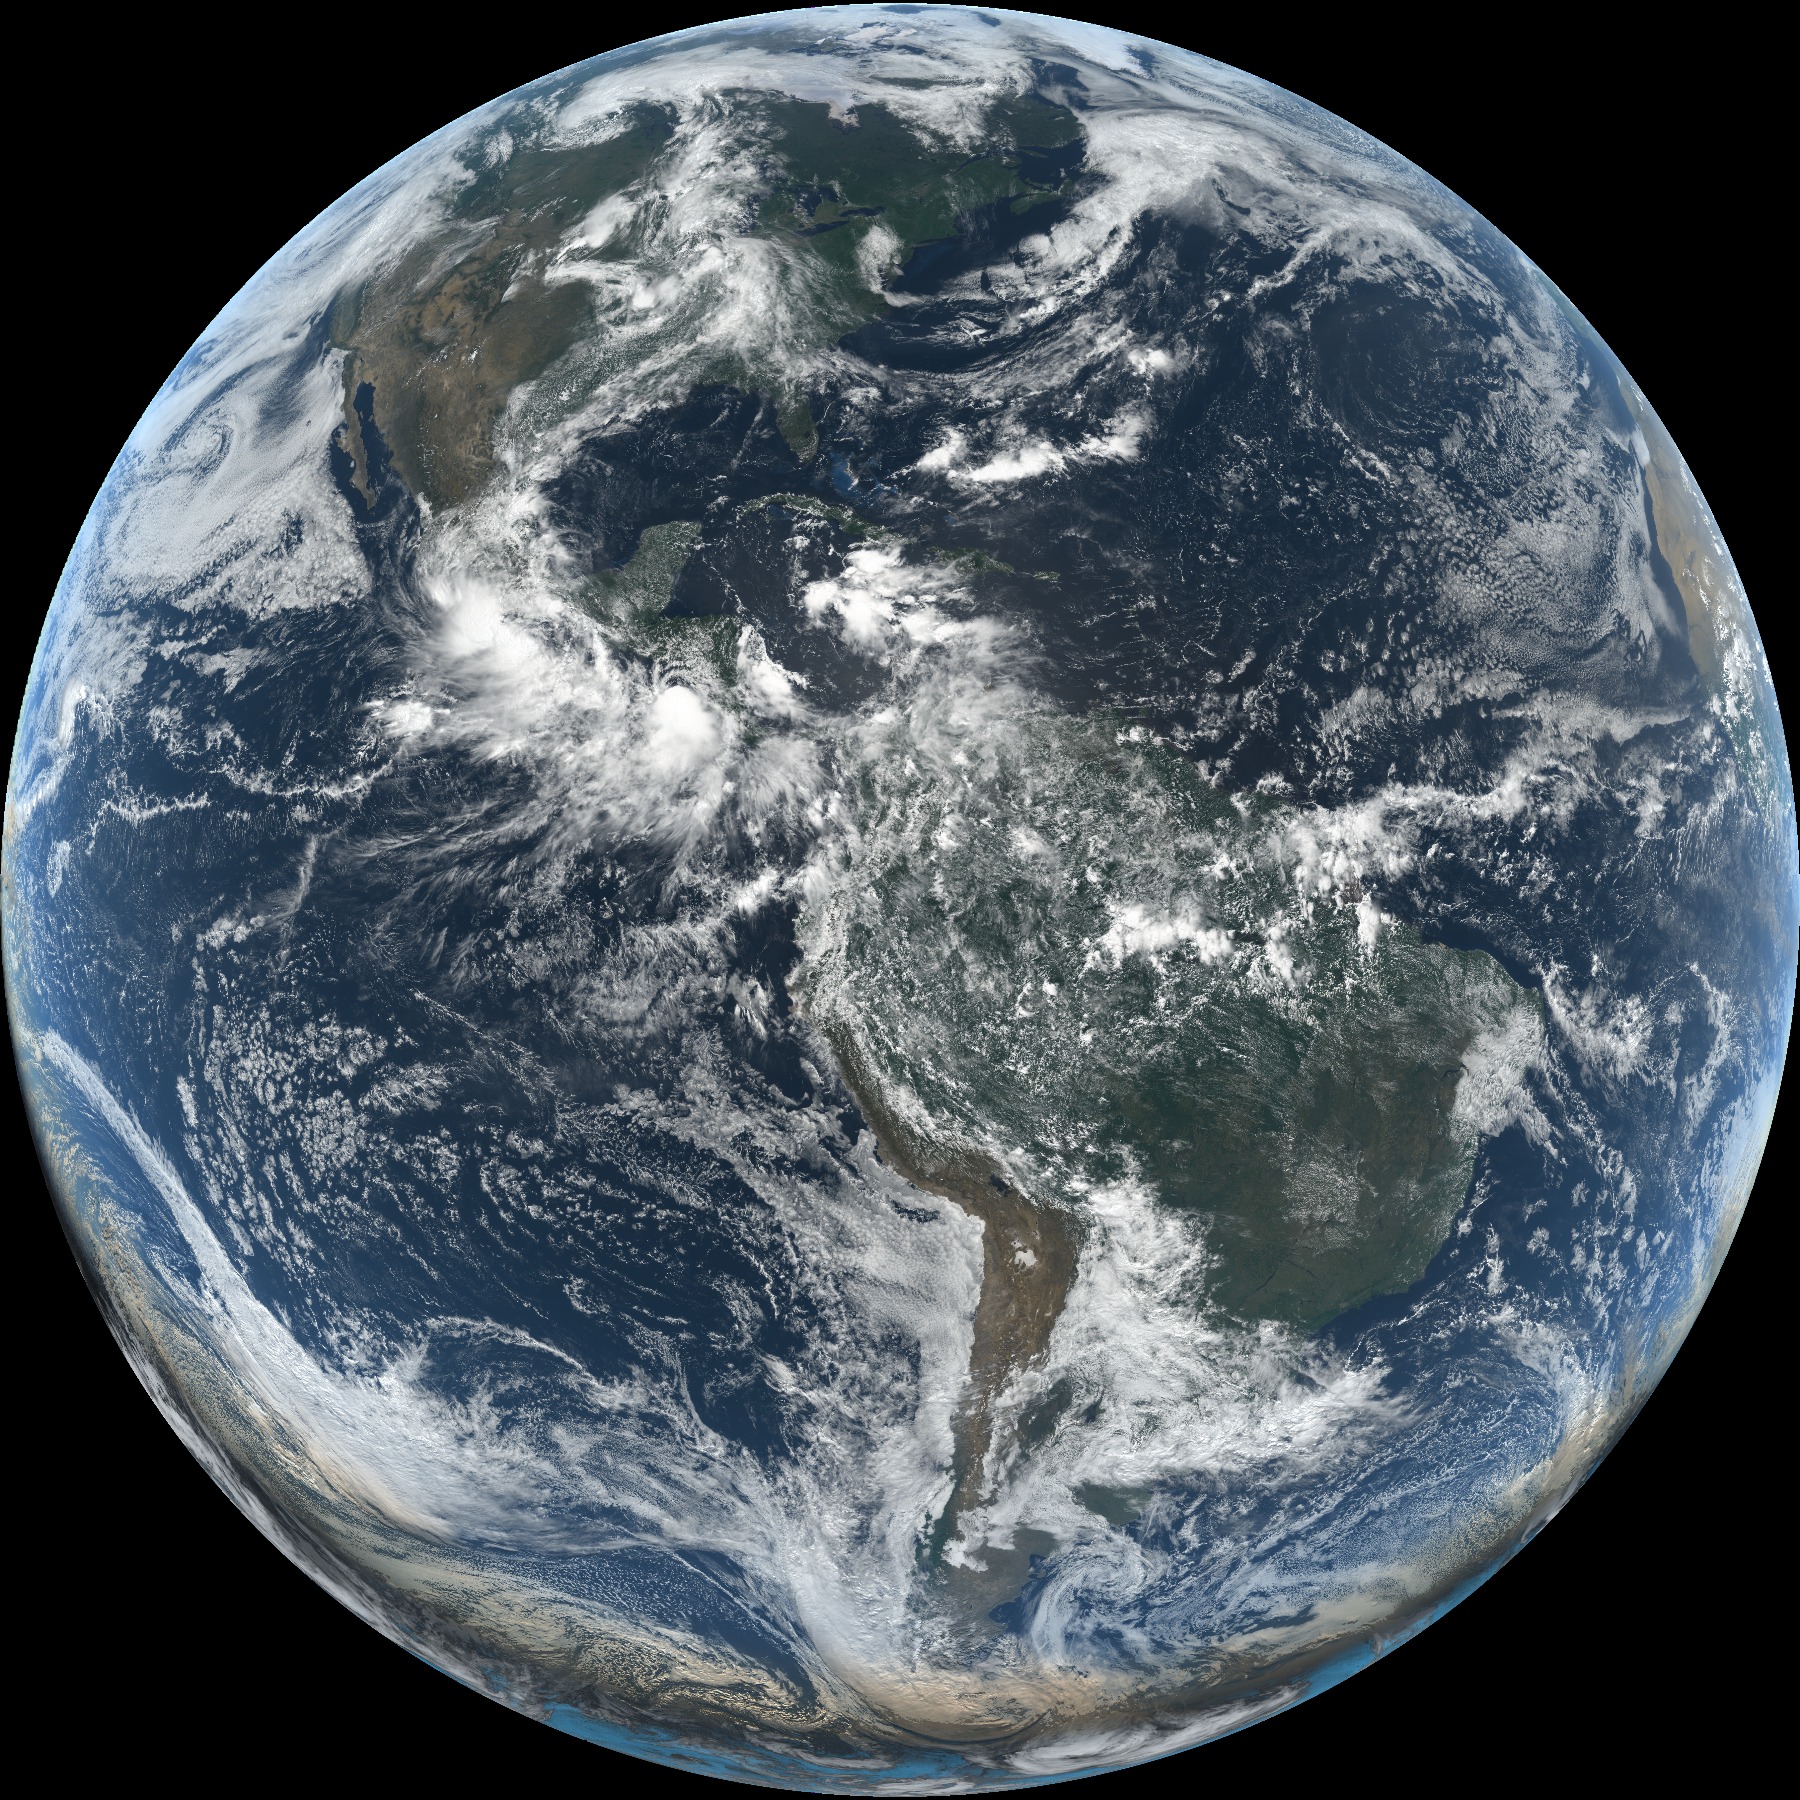
Imagery is pre-rendered on our servers and streamed to your device — smooth zoom and animation loops that stay sharp at every scale.
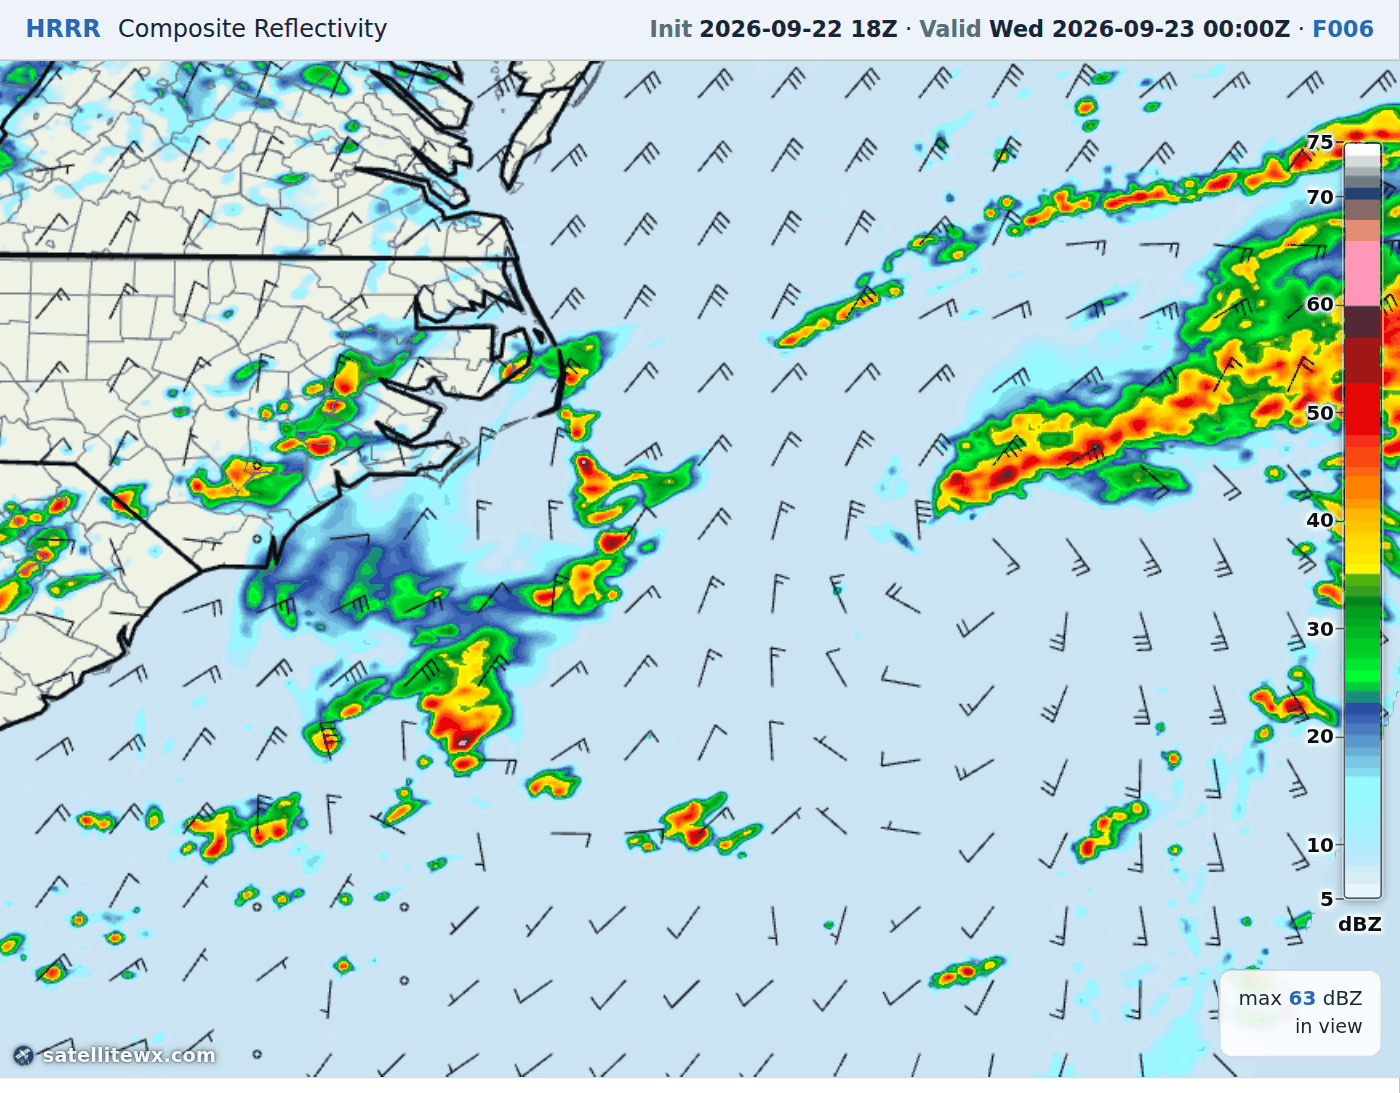
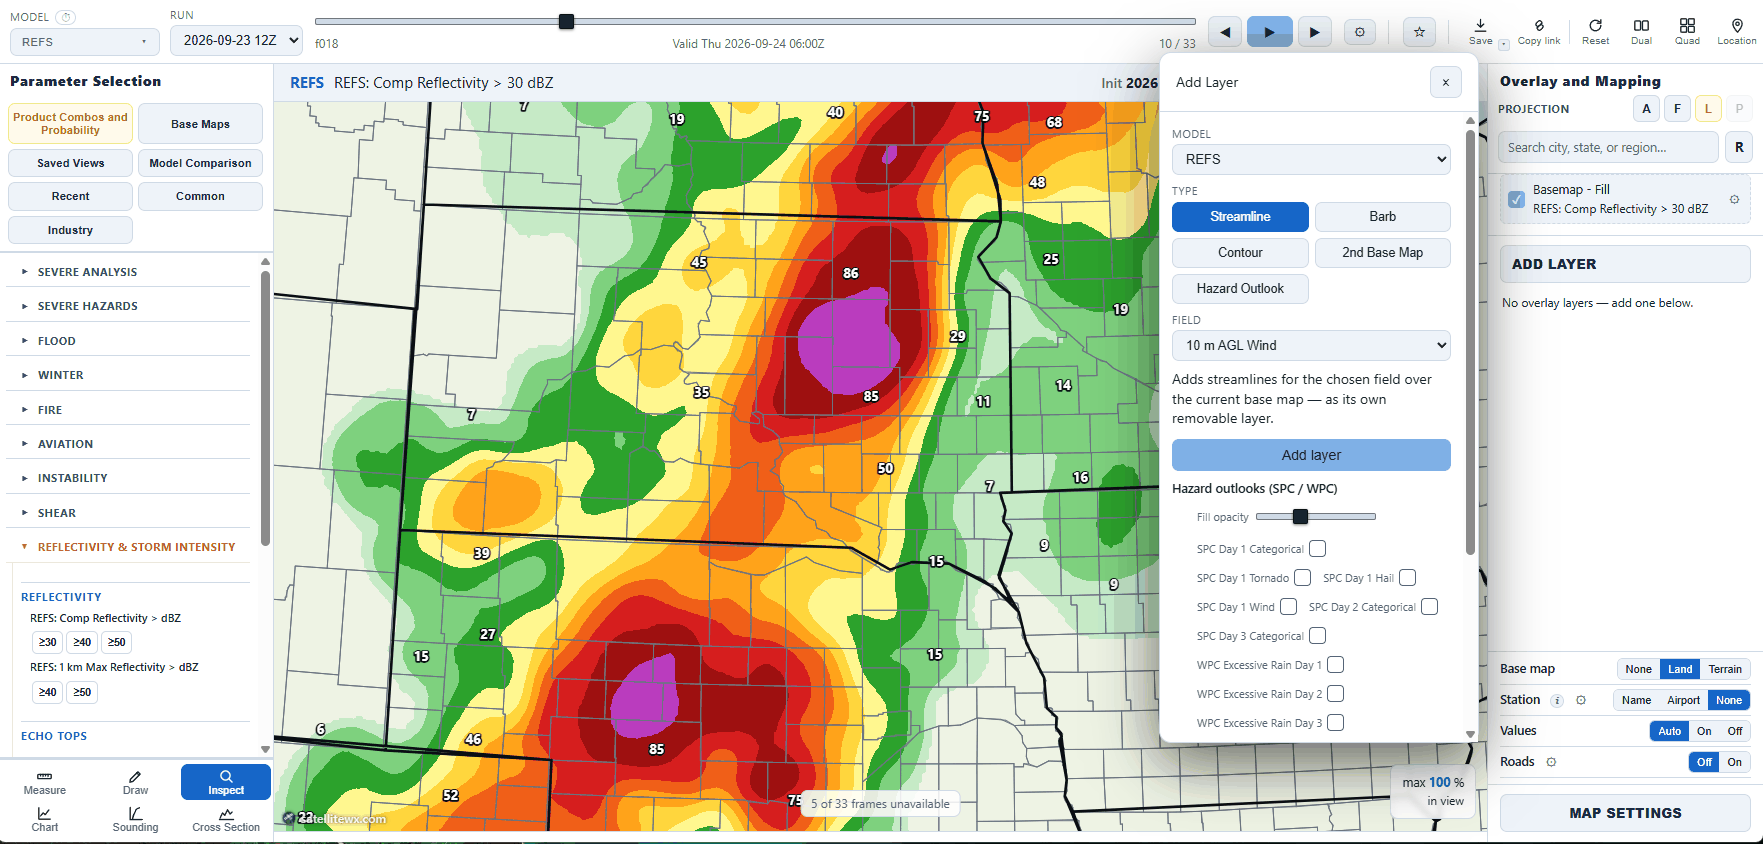
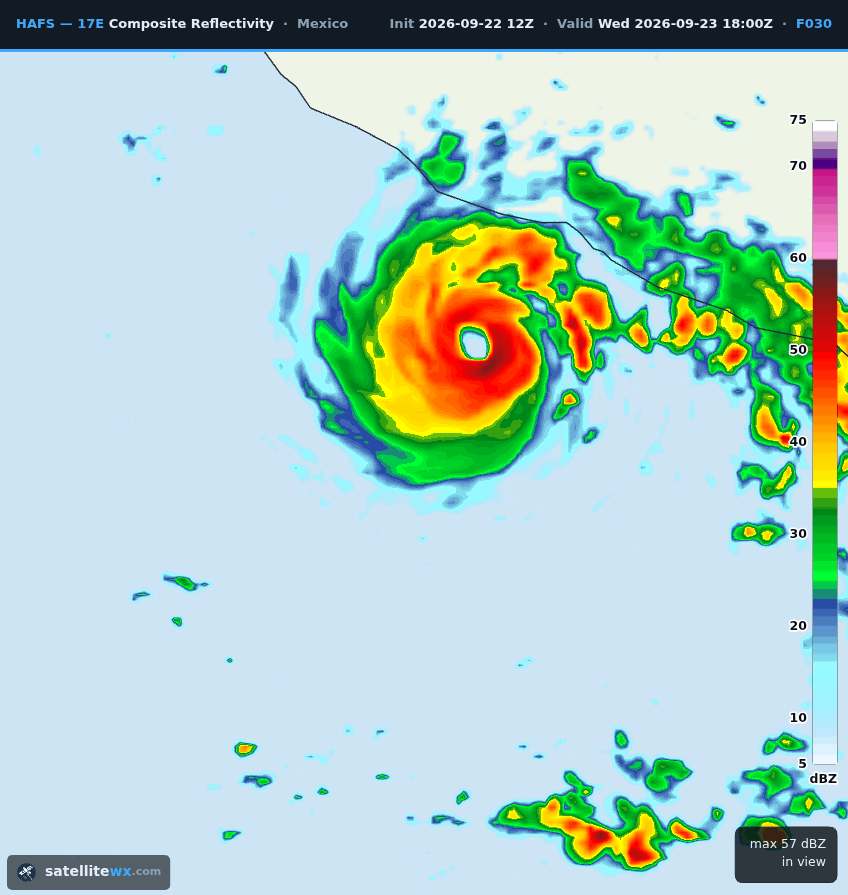
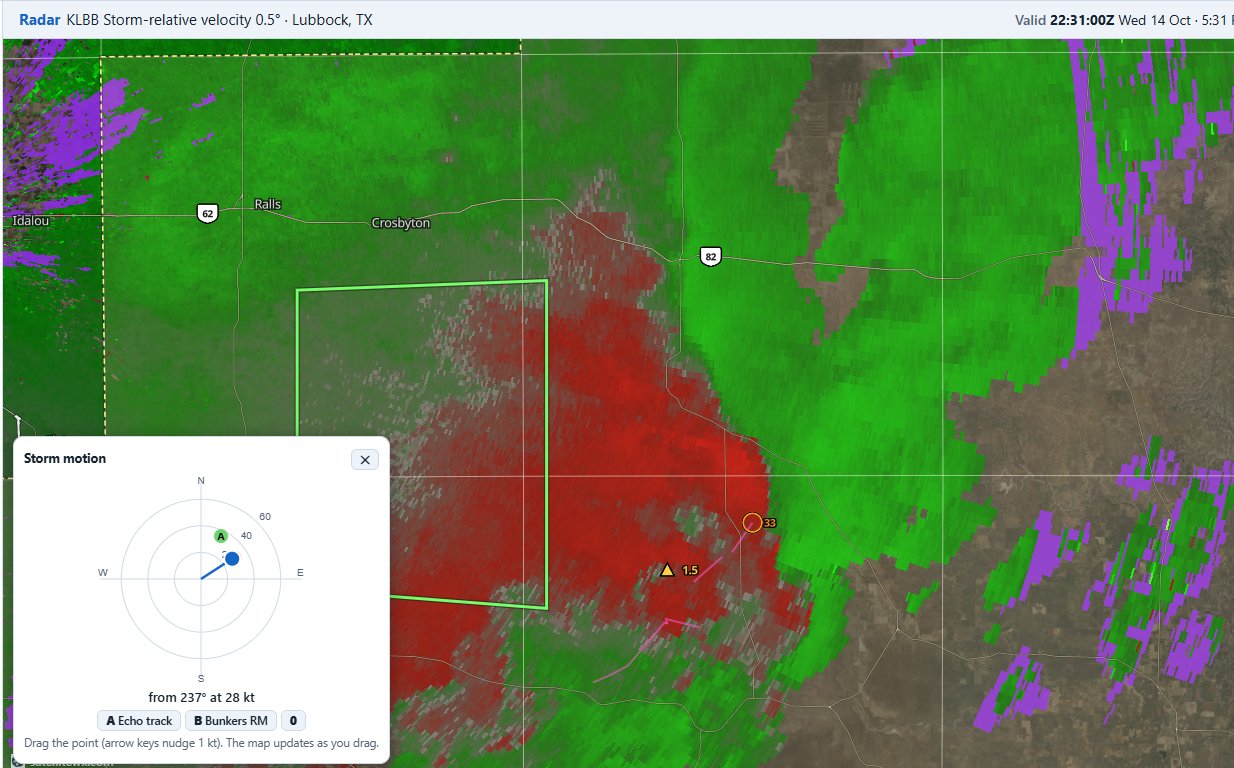
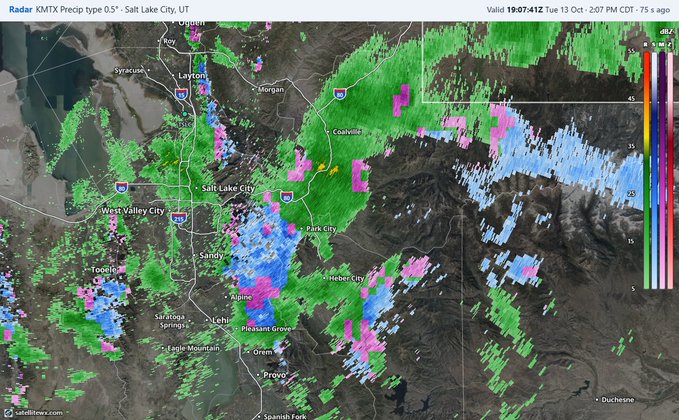
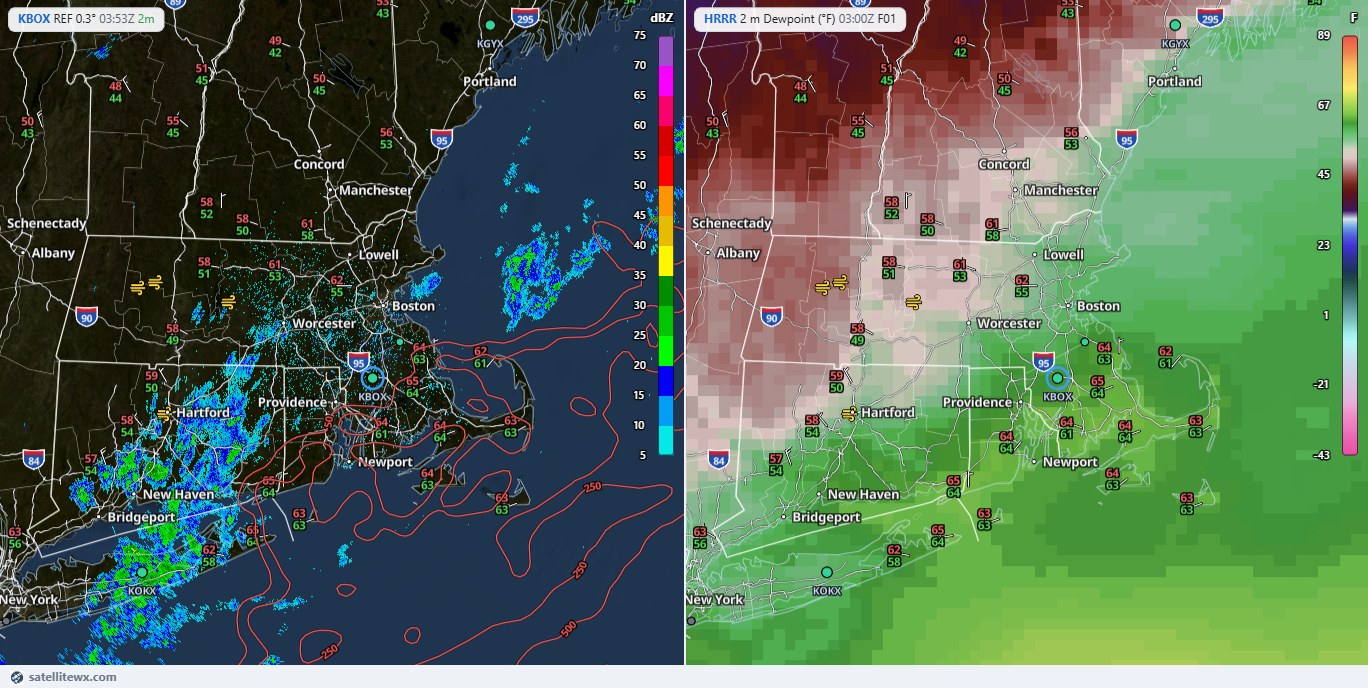
Drop radar, lightning, warnings, and model fields right onto the imagery.
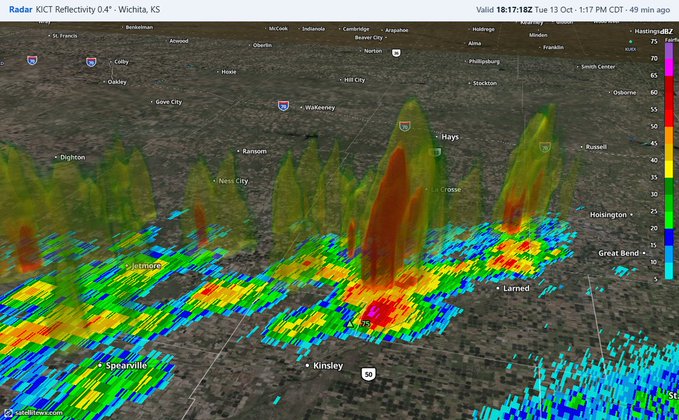
Pinch and pan from the full hemisphere down to your metro area.
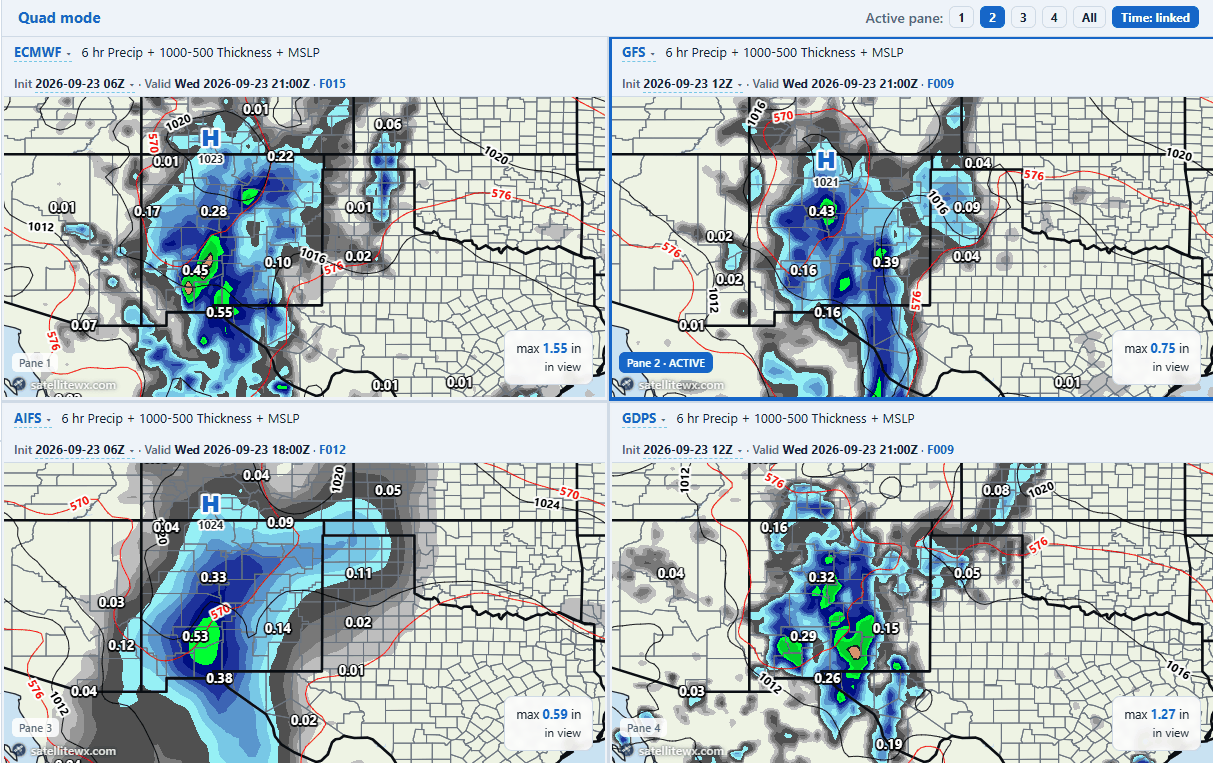
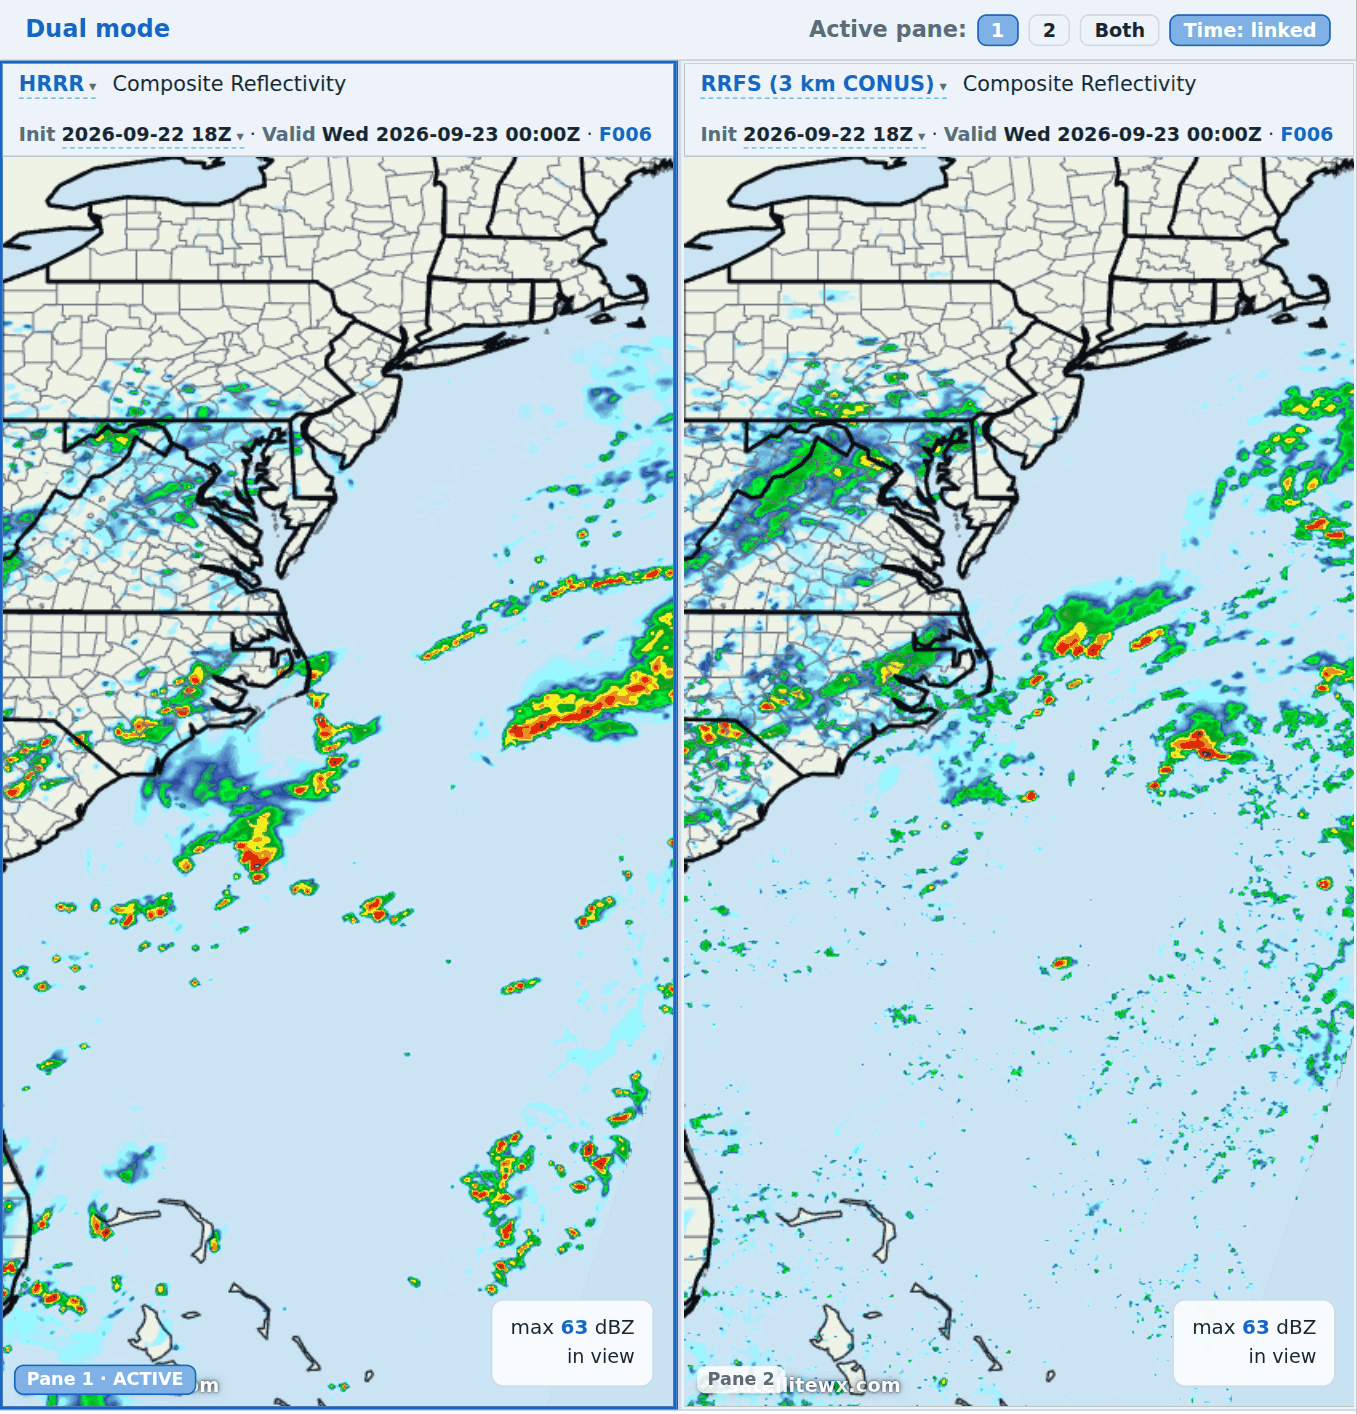
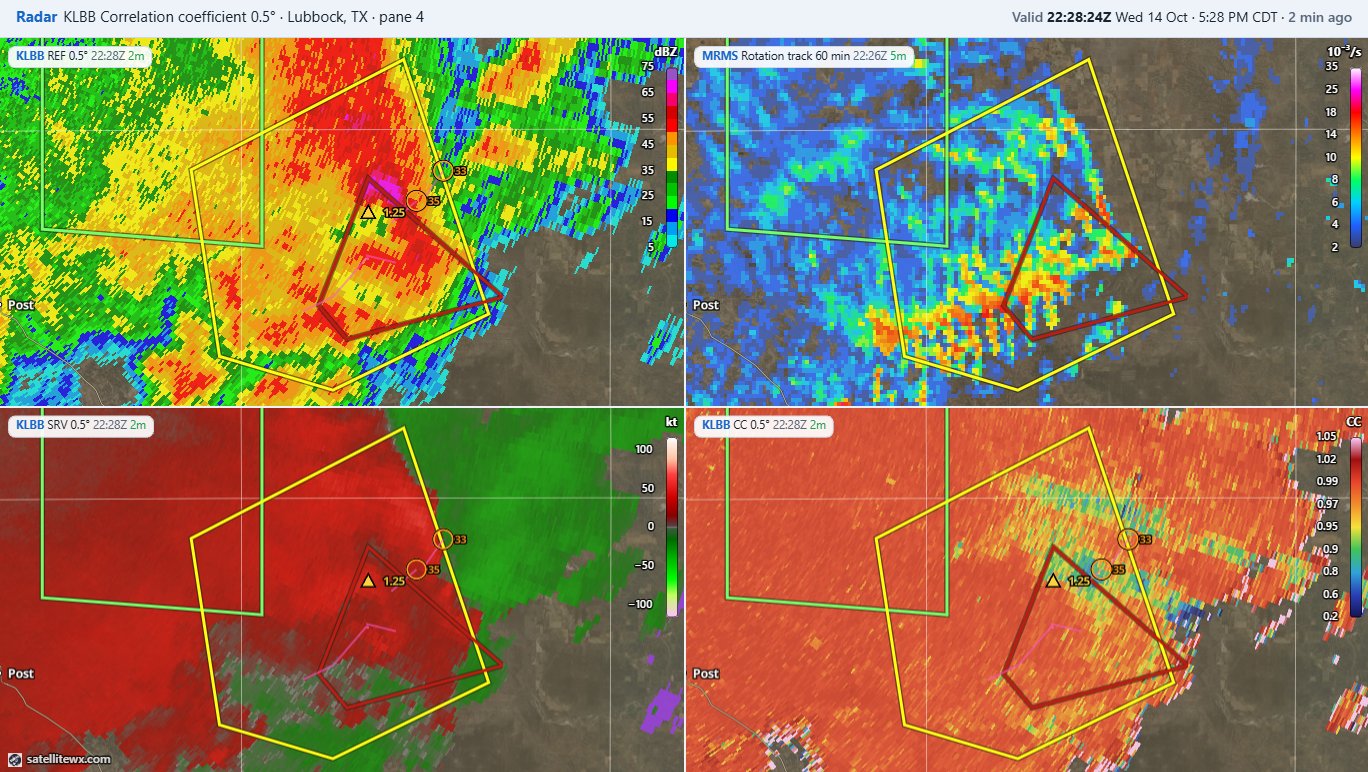
Dual- and quad-pane views, time-locked to the same frame.
Our backend calibrates all 16 ABI channels around the clock and layers real-time weather data on top — radar, lightning, warnings, and model fields.
All 16 ABI channels plus 9 RGB composites — GeoColor, Sandwich, AirMass, Fire Temperature, Dust, and more — from hemispheric full-disk to 1-minute mesoscale.
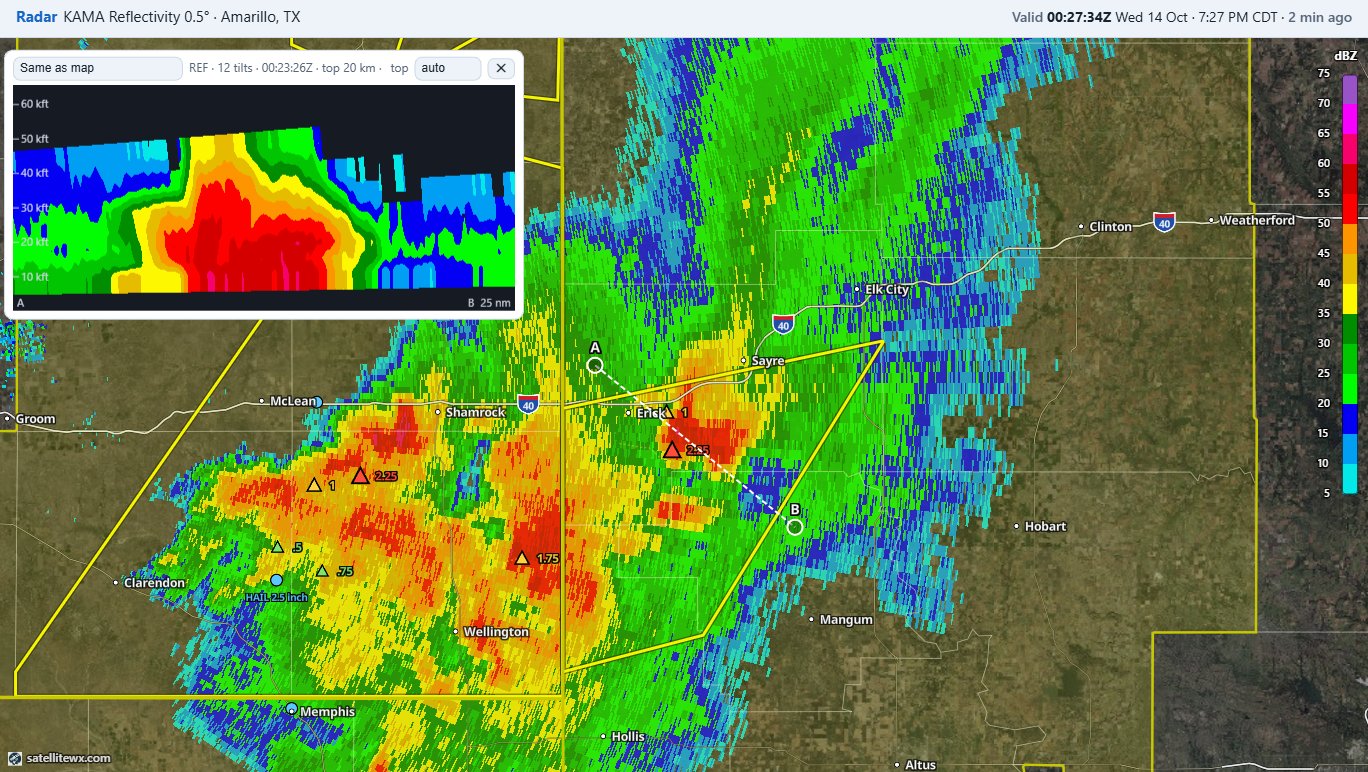
NWS tornado, severe, and flash-flood warnings, SPC convective outlooks, WPC excessive-rainfall outlooks, and ProbSevere storm probabilities.
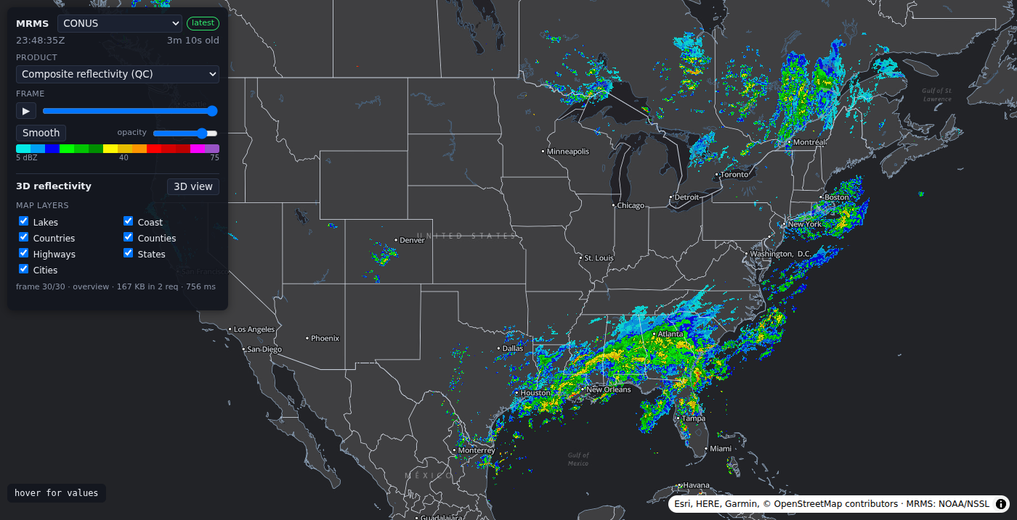
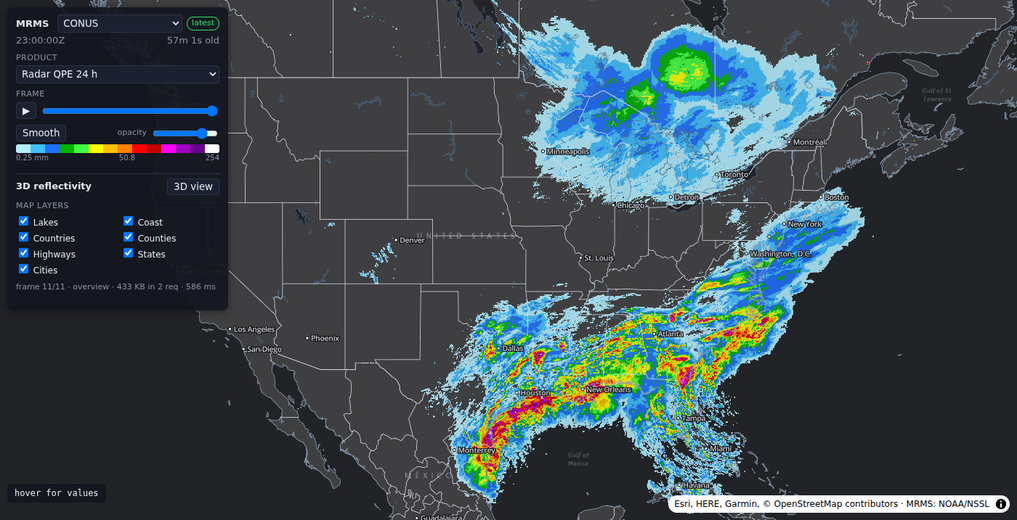
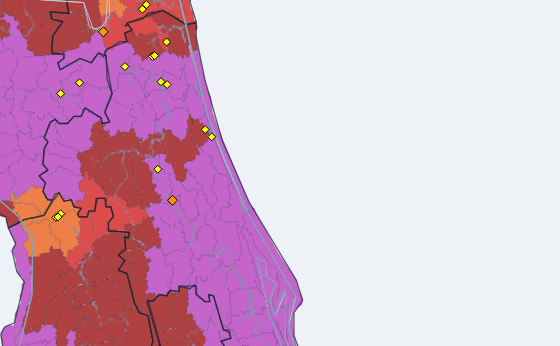
MRMS multi-radar composite reflectivity overlaid on the image, plus GLM lightning straight from the satellite — flash points, density, and minimum flash area.
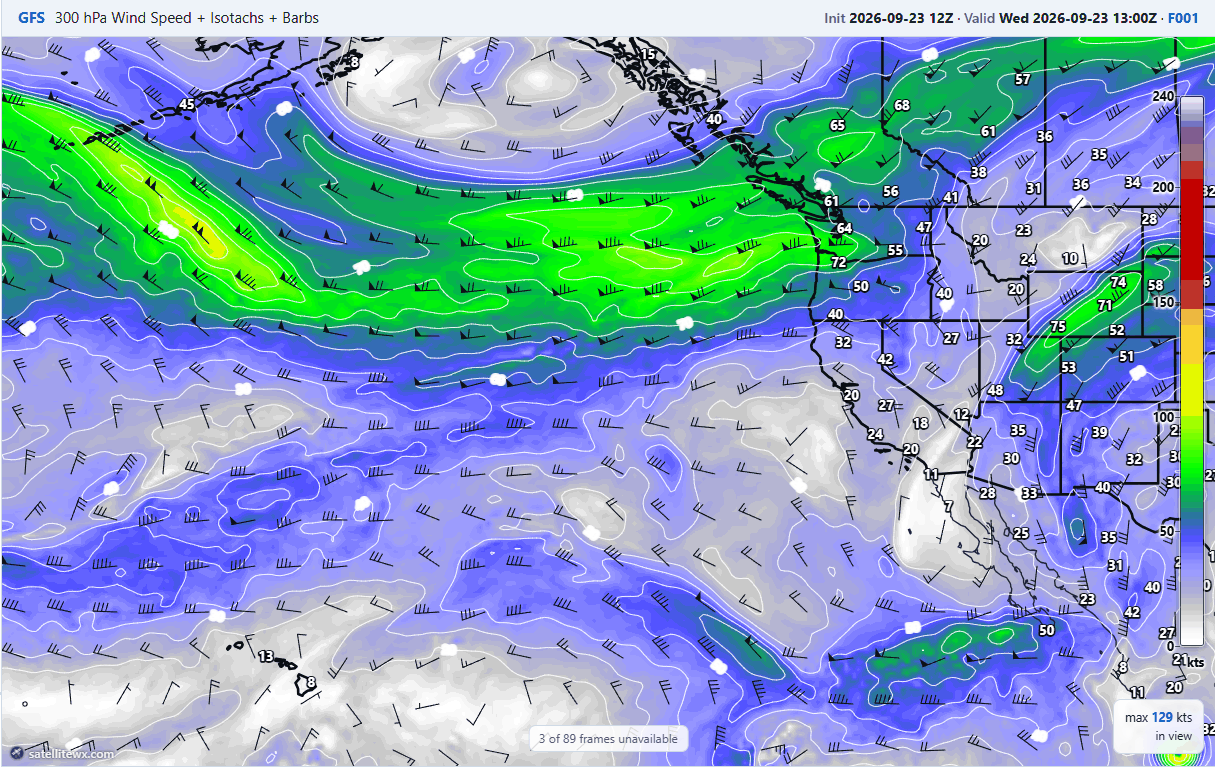
RTMA temperature, dewpoint and wind; RAP upper-air fields at five pressure levels; METAR station plots with standard symbology.
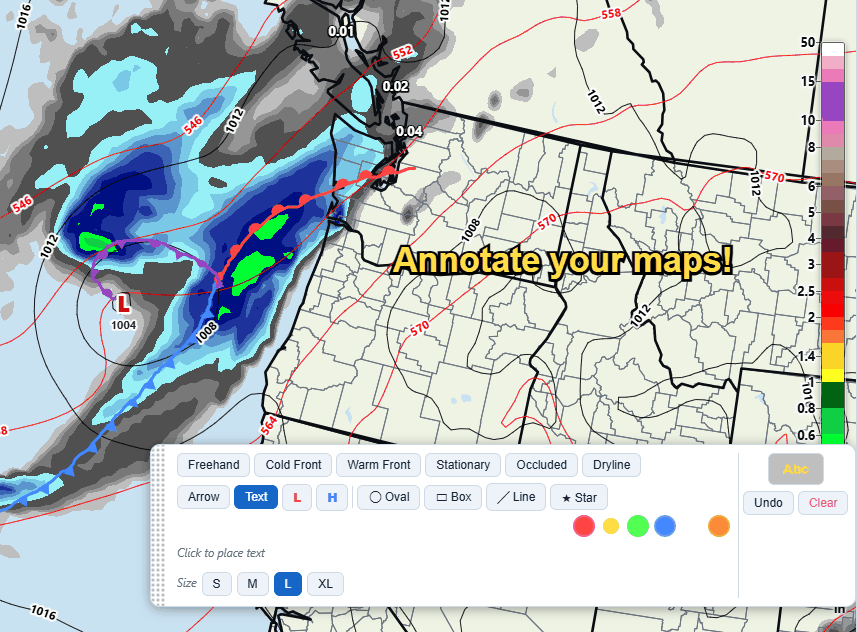
Front drawing, pixel inspector with real channel values, distance measurement, time-series charting, and screenshot / animated-GIF export.
Save any combination of domain, product, overlays, and loop settings. A free account syncs them across web, iOS, and Android.
Draw fronts & annotate
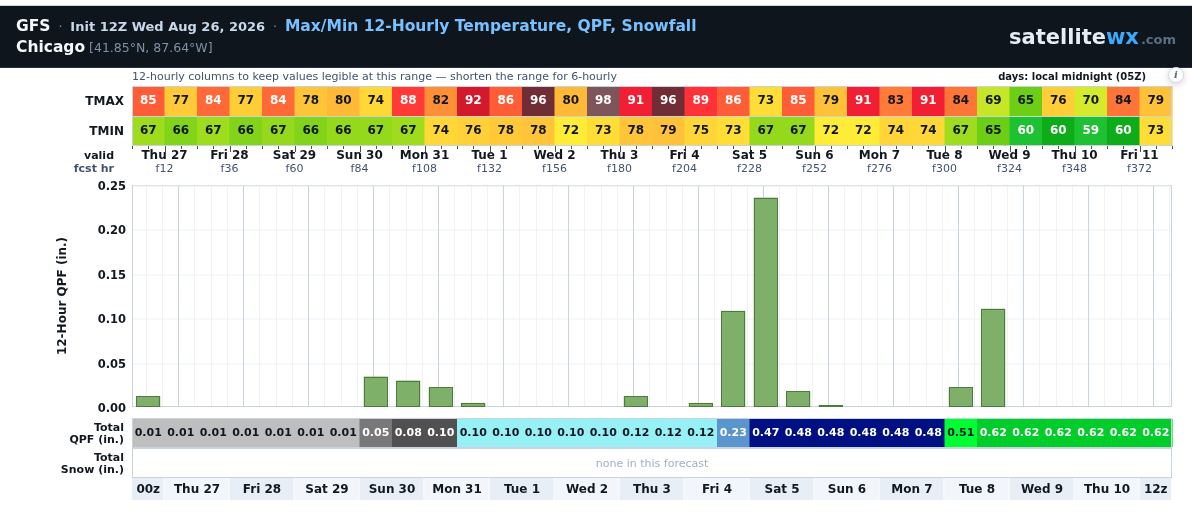
Time series — track a point over the loop
Every product is generated across dozens of domains — and the fastest sectors refresh as quickly as the satellite scans.
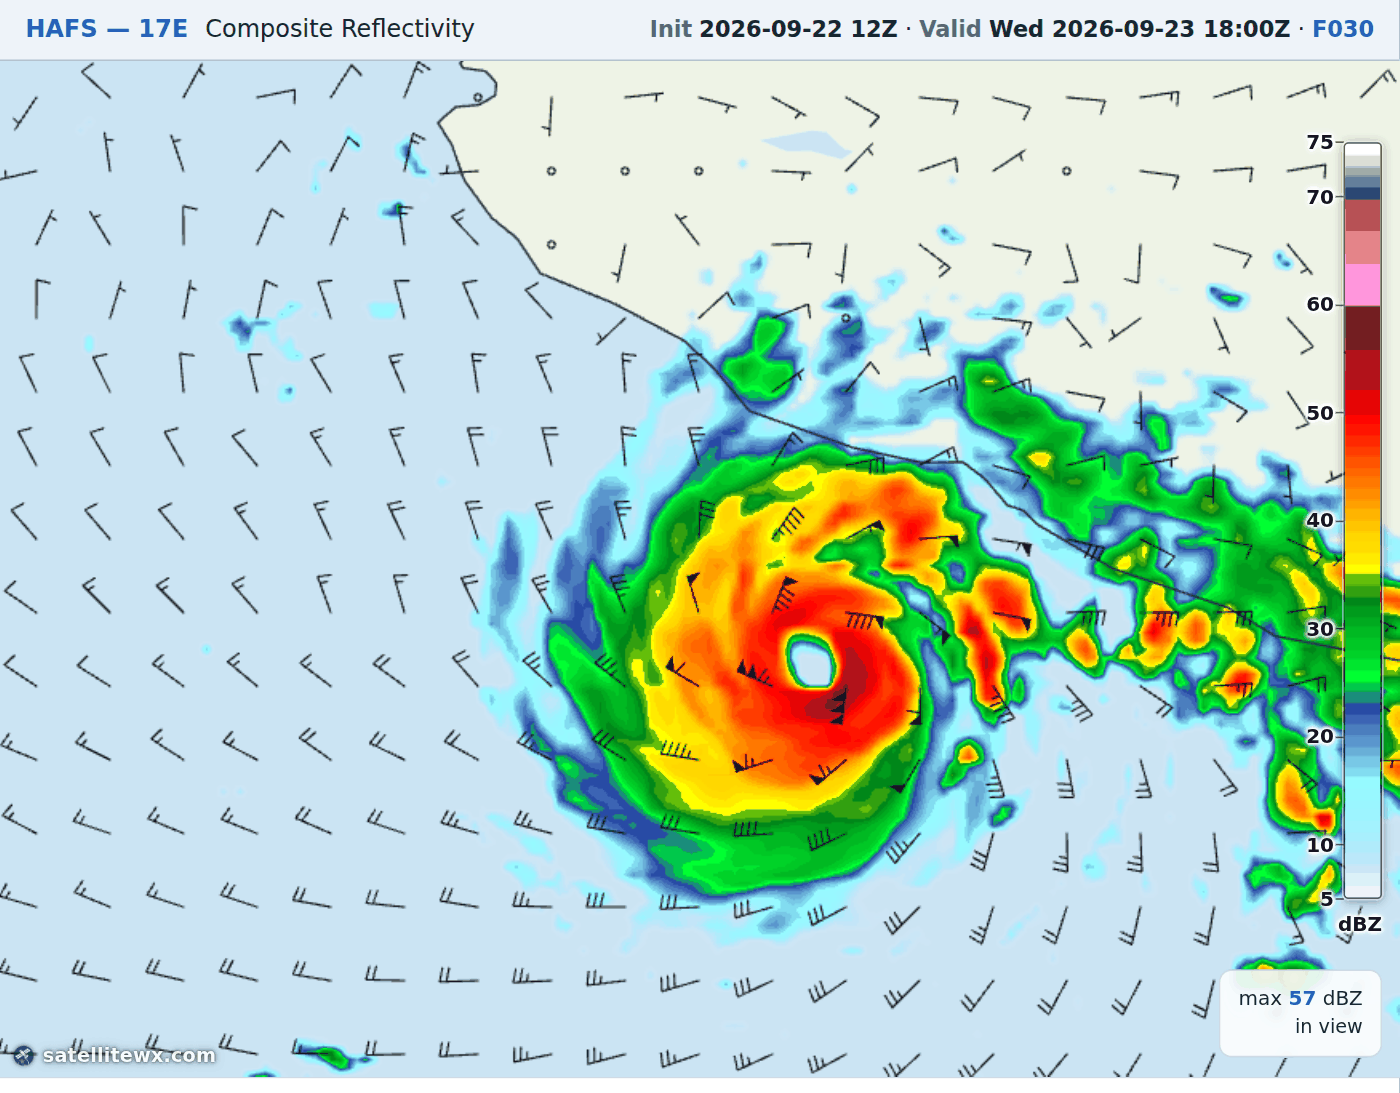
Entire Western Hemisphere — hurricanes & large-scale patterns.
The continental-US workhorse, all day, every day.
NWS-targeted sectors aimed at active severe weather & fires.
Numerous regional to local sectors from the Full Disk and CONUS datasets.
The processing happens on our servers — your device just displays the result, fast even on older phones.
Raw GOES ABI data is pulled from NOAA's buckets and all 16 channels are calibrated to real radiances and brightness temperatures.
Numba-accelerated algorithms build RGB products and project everything onto regional Mercator grids — GeoColor day/night, AirMass, and more.
Radar, lightning, warnings, and model fields are rasterized onto matching grids and written as ready-to-view images for web and mobile.
Every new account starts with a 14-day free trial of Pro — every domain, every channel, all overlays, radar, lightning, and the archive. Keep it for $19.99/year, or drop to Free anytime.
14 days free, then your selected plan auto-renews until cancelled — cancel anytime. By subscribing you agree to our Terms and Privacy Policy.
Create a free account to save favorites and carry them across web, iOS, and Android. Sign in with a magic-link email, Google, or Apple — no separate registration step.
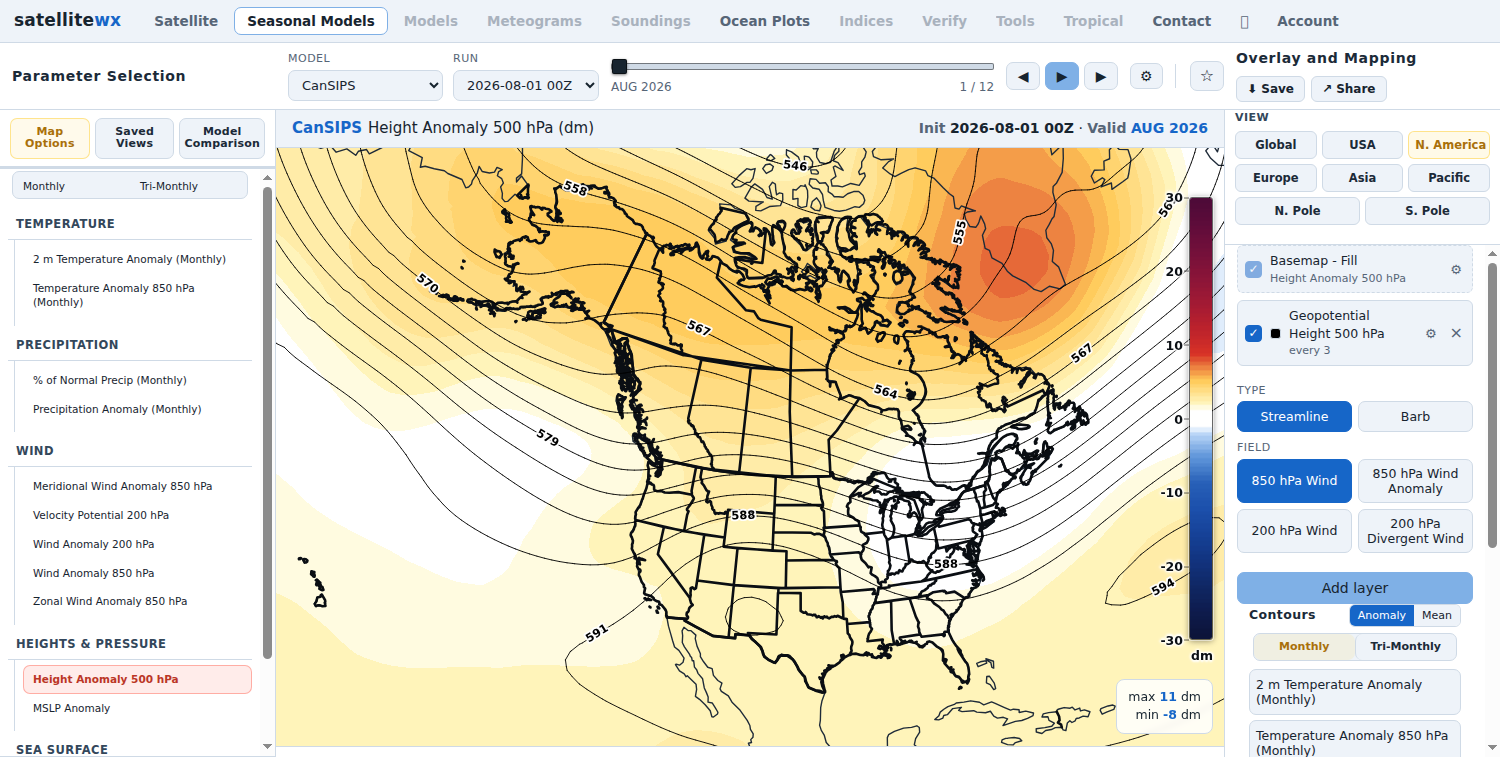
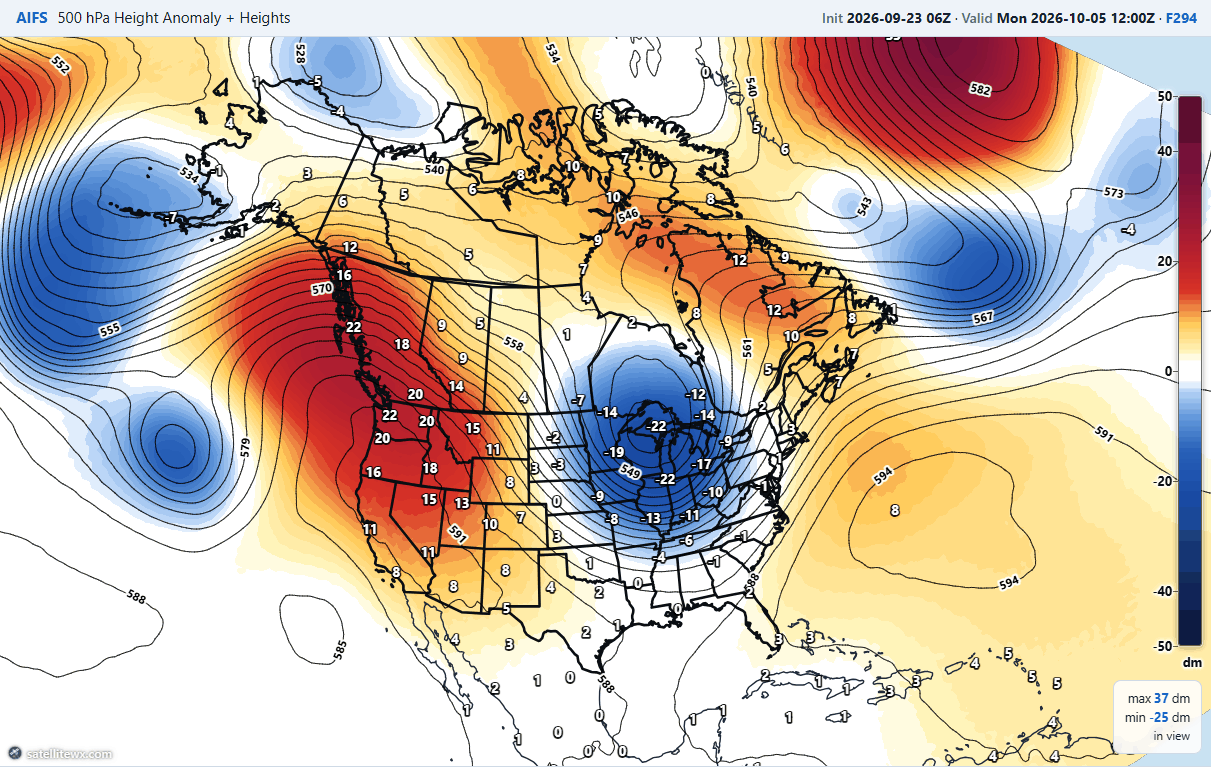
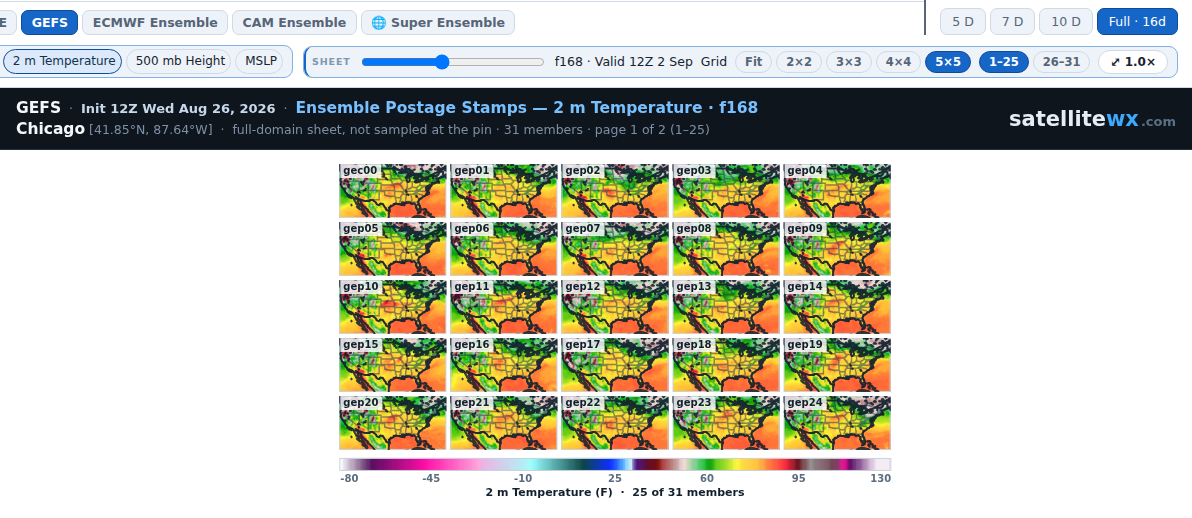
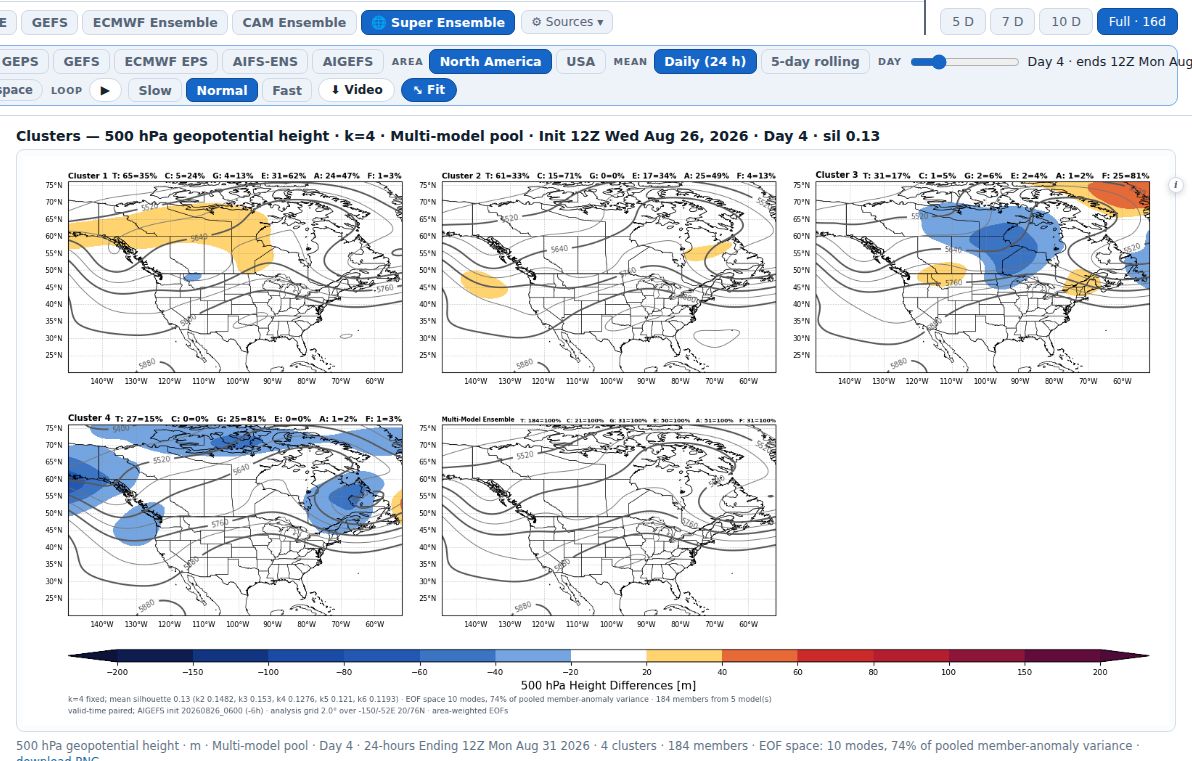
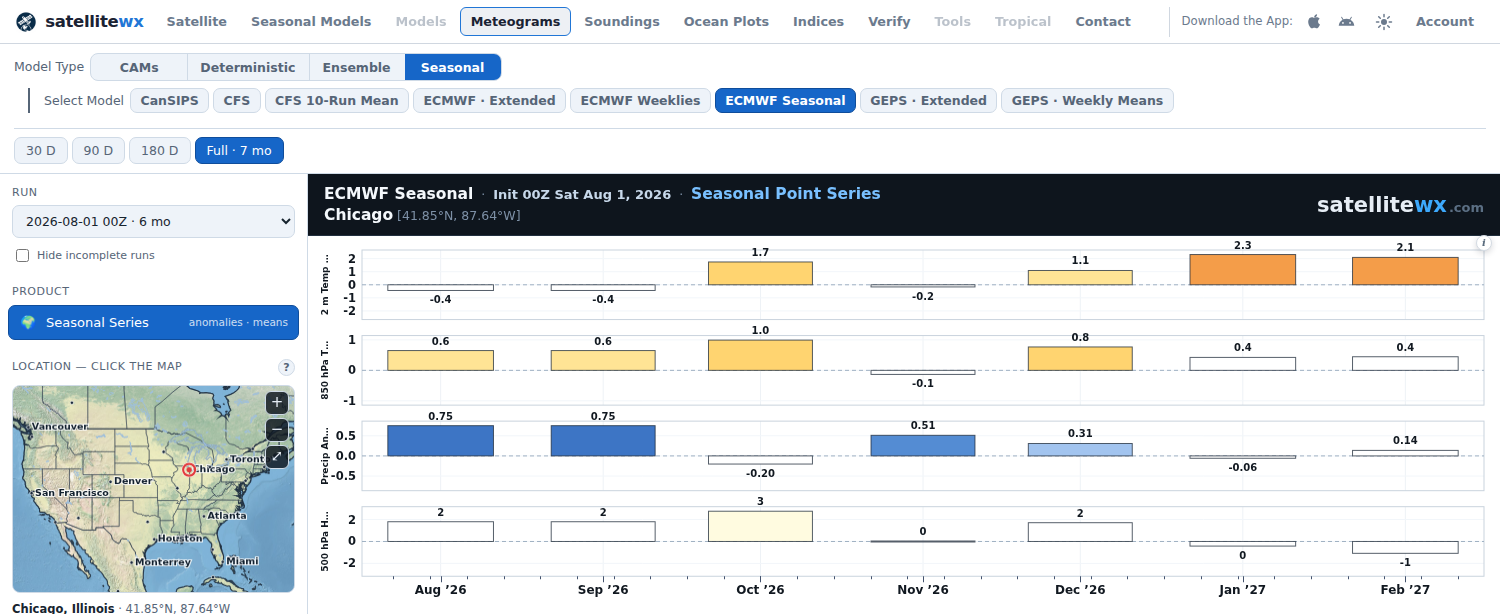
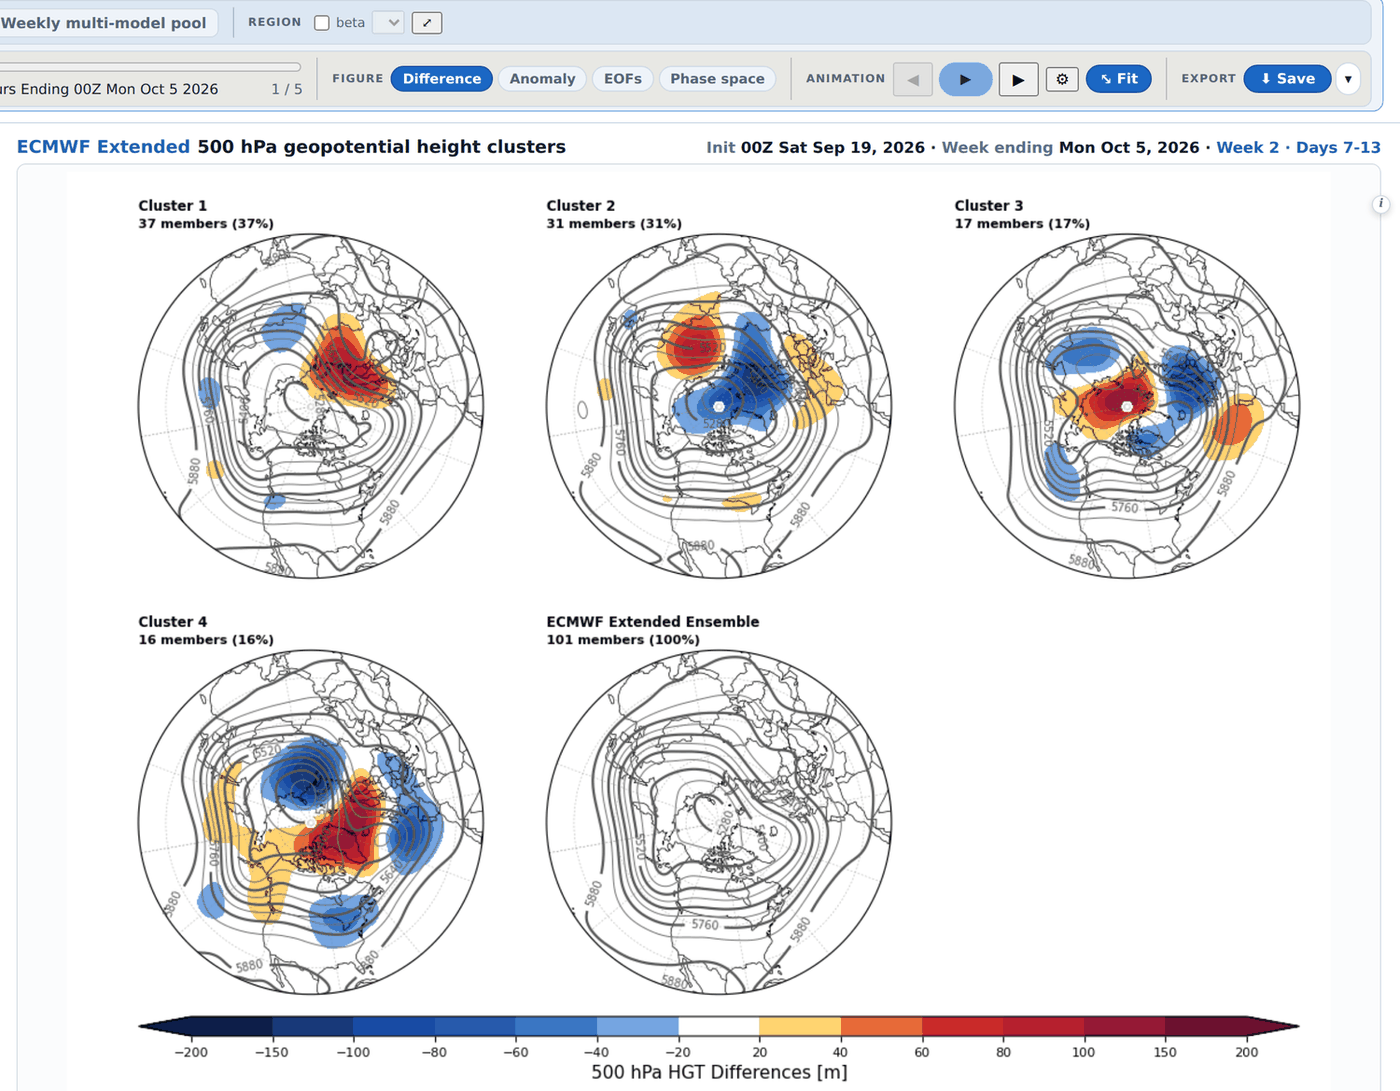
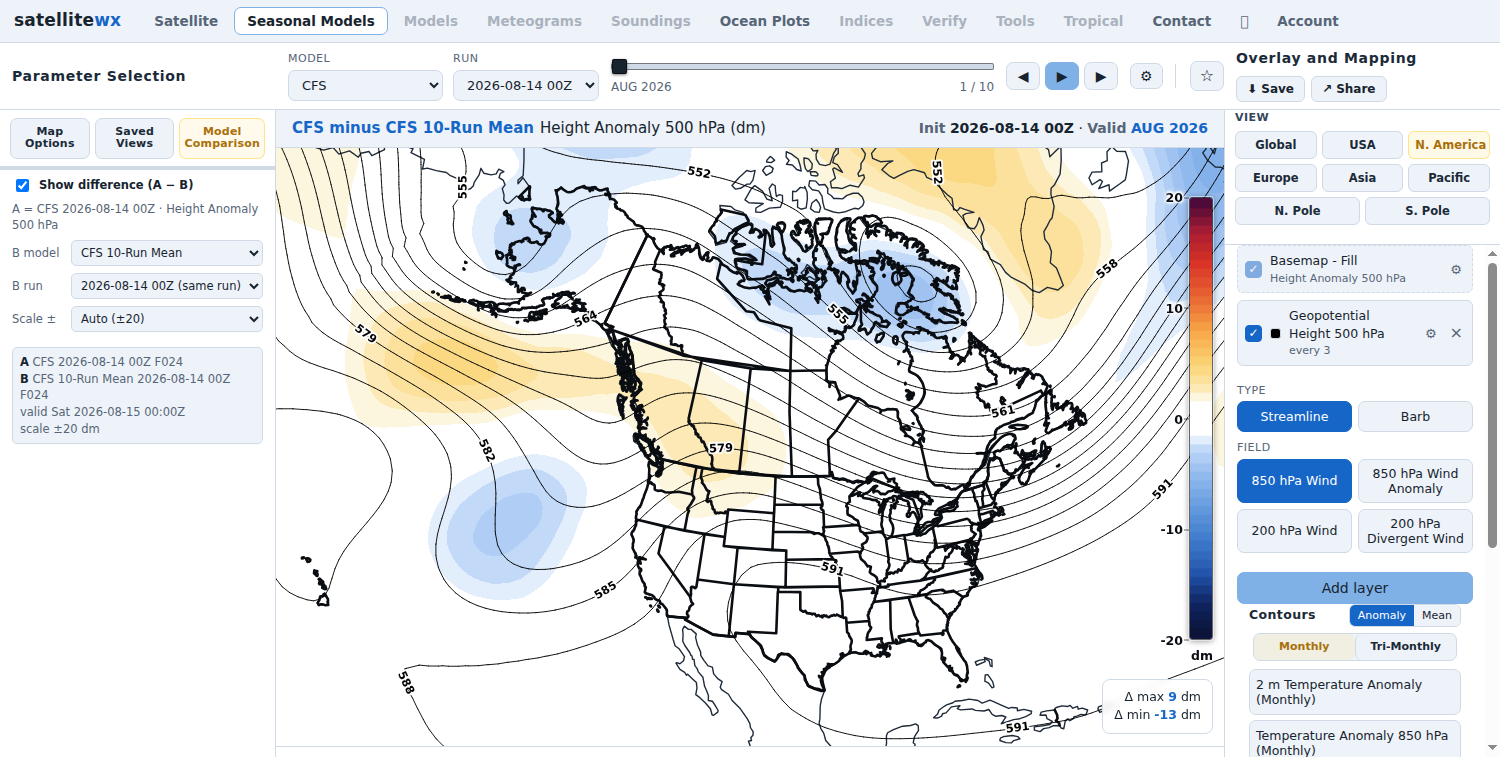
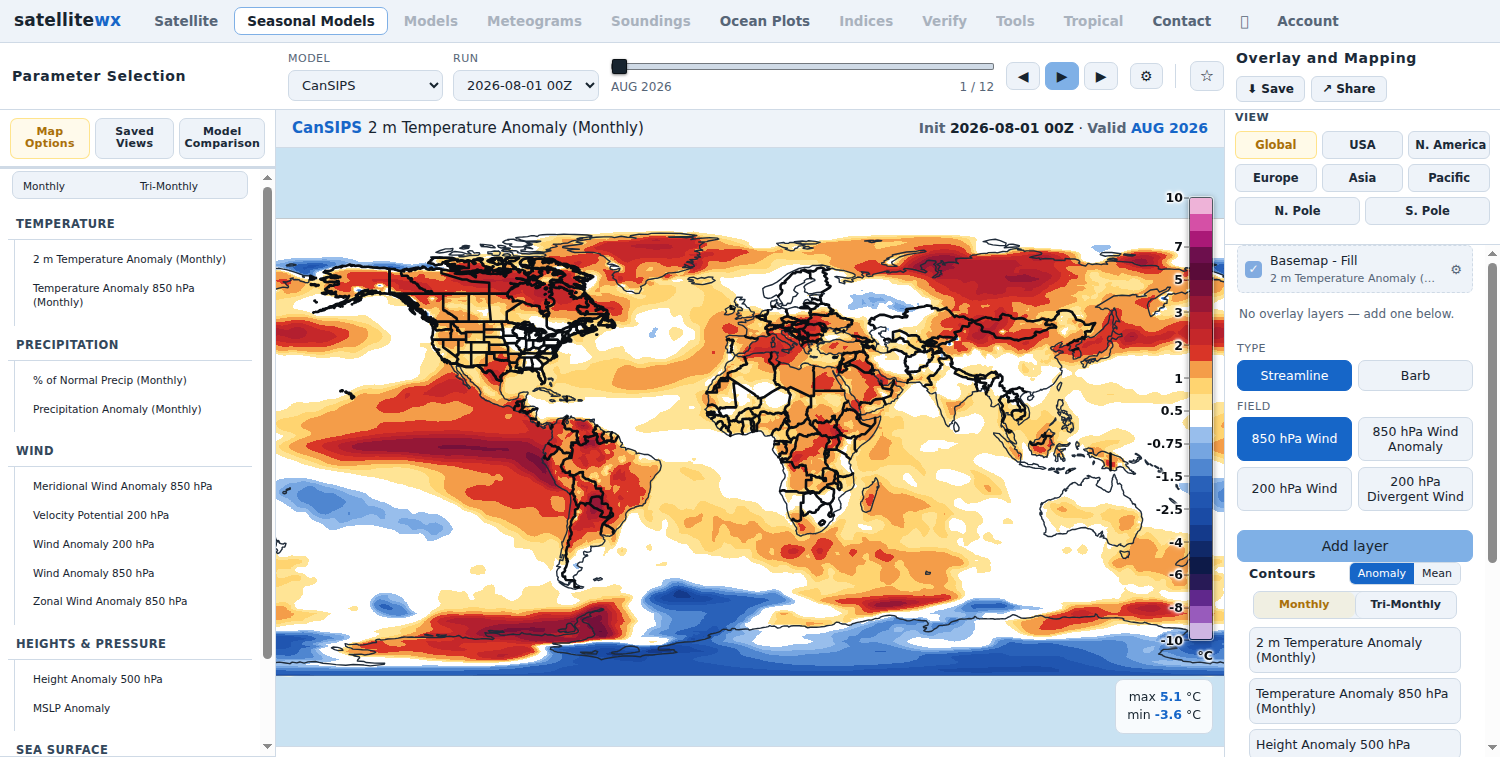
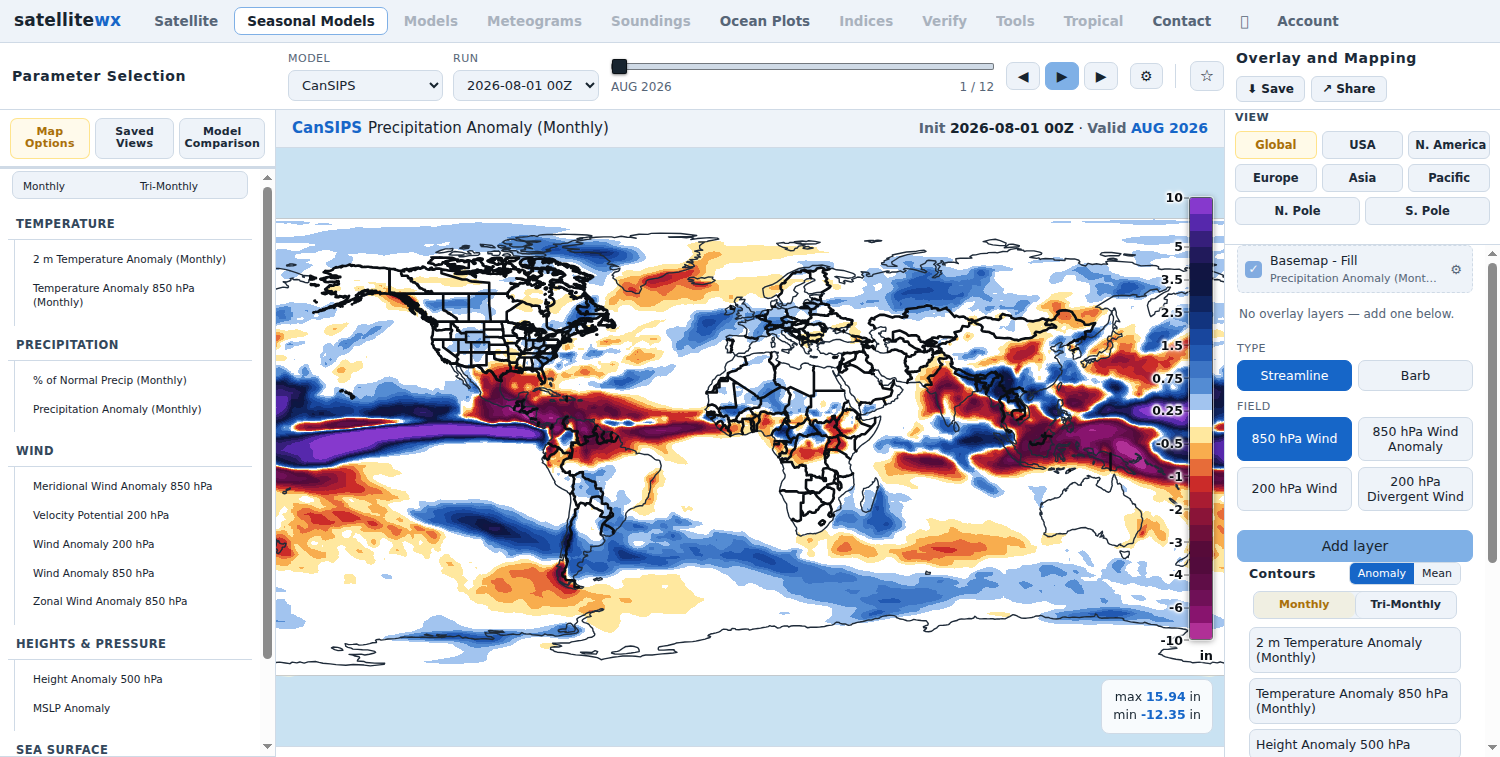
CFS, CanSIPS, ECMWF S2S and GEPS — monthly and tri-monthly anomalies for temperature, precipitation, wind and heights. The long-range guidance forecasters actually argue about, plotted the way you'd plot it yourself.
2 m and 850 hPa temperature anomalies, precipitation anomaly and percent-of-normal, monthly or tri-monthly.
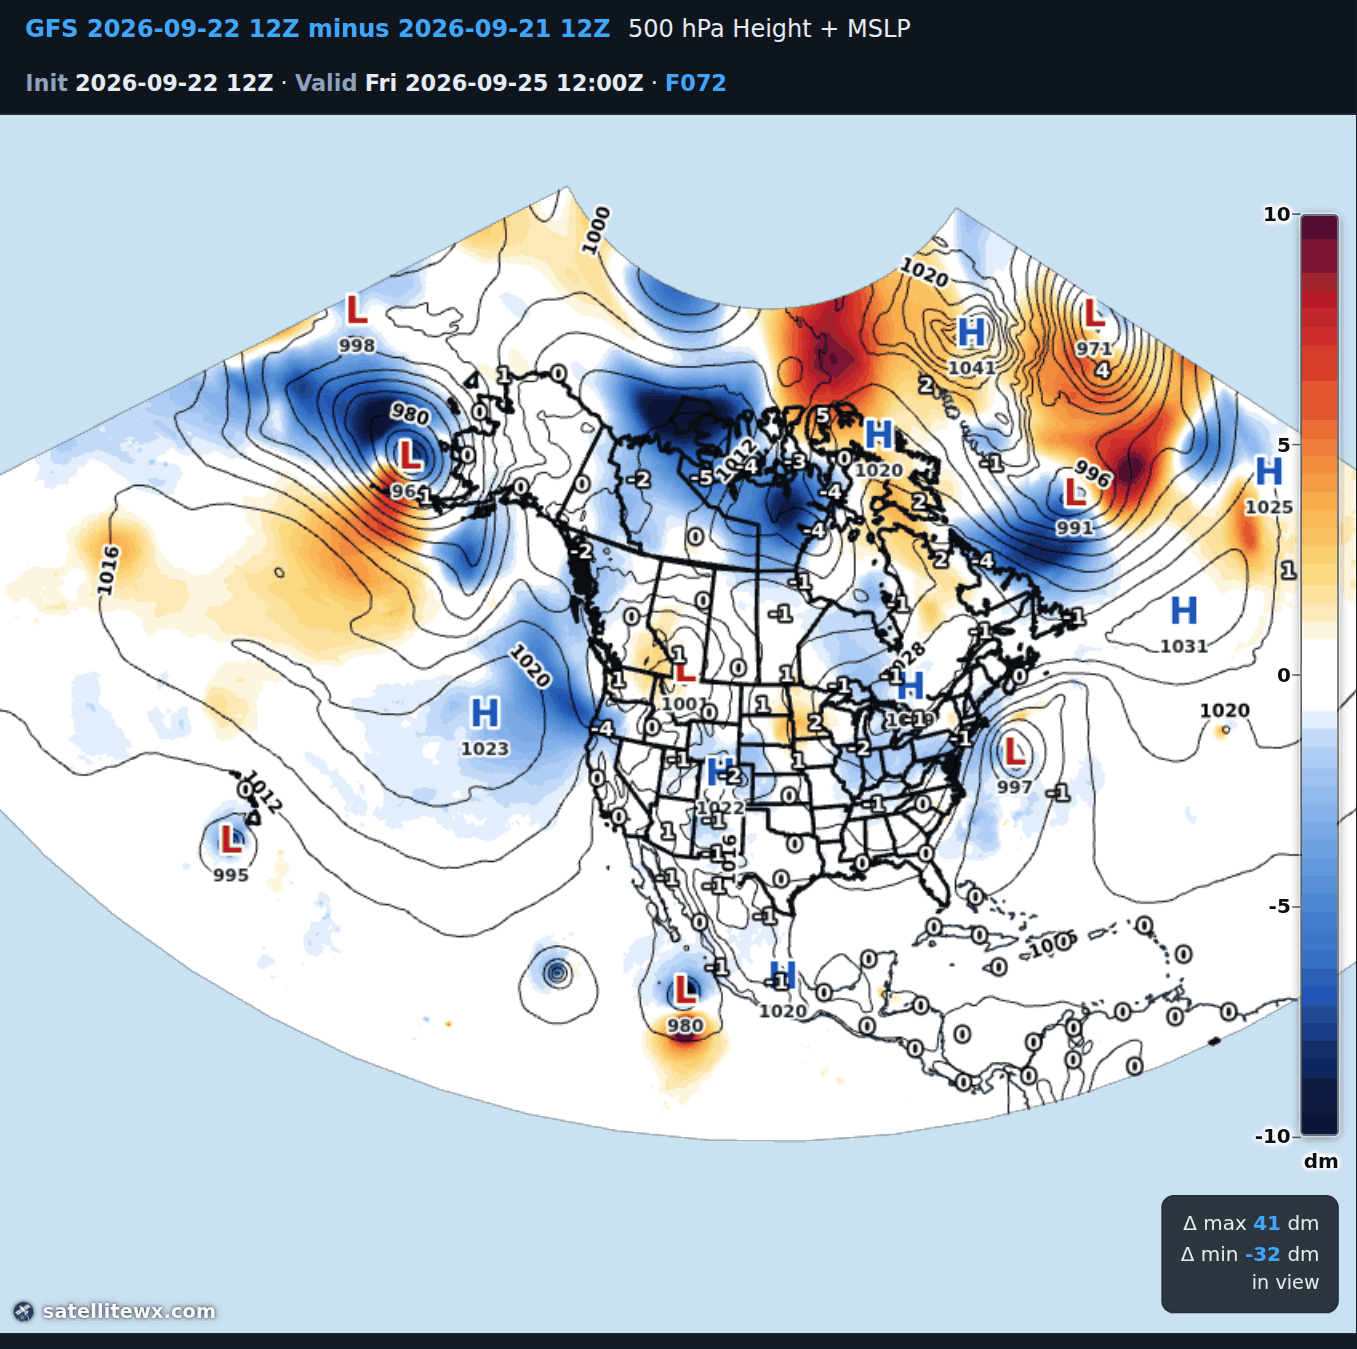
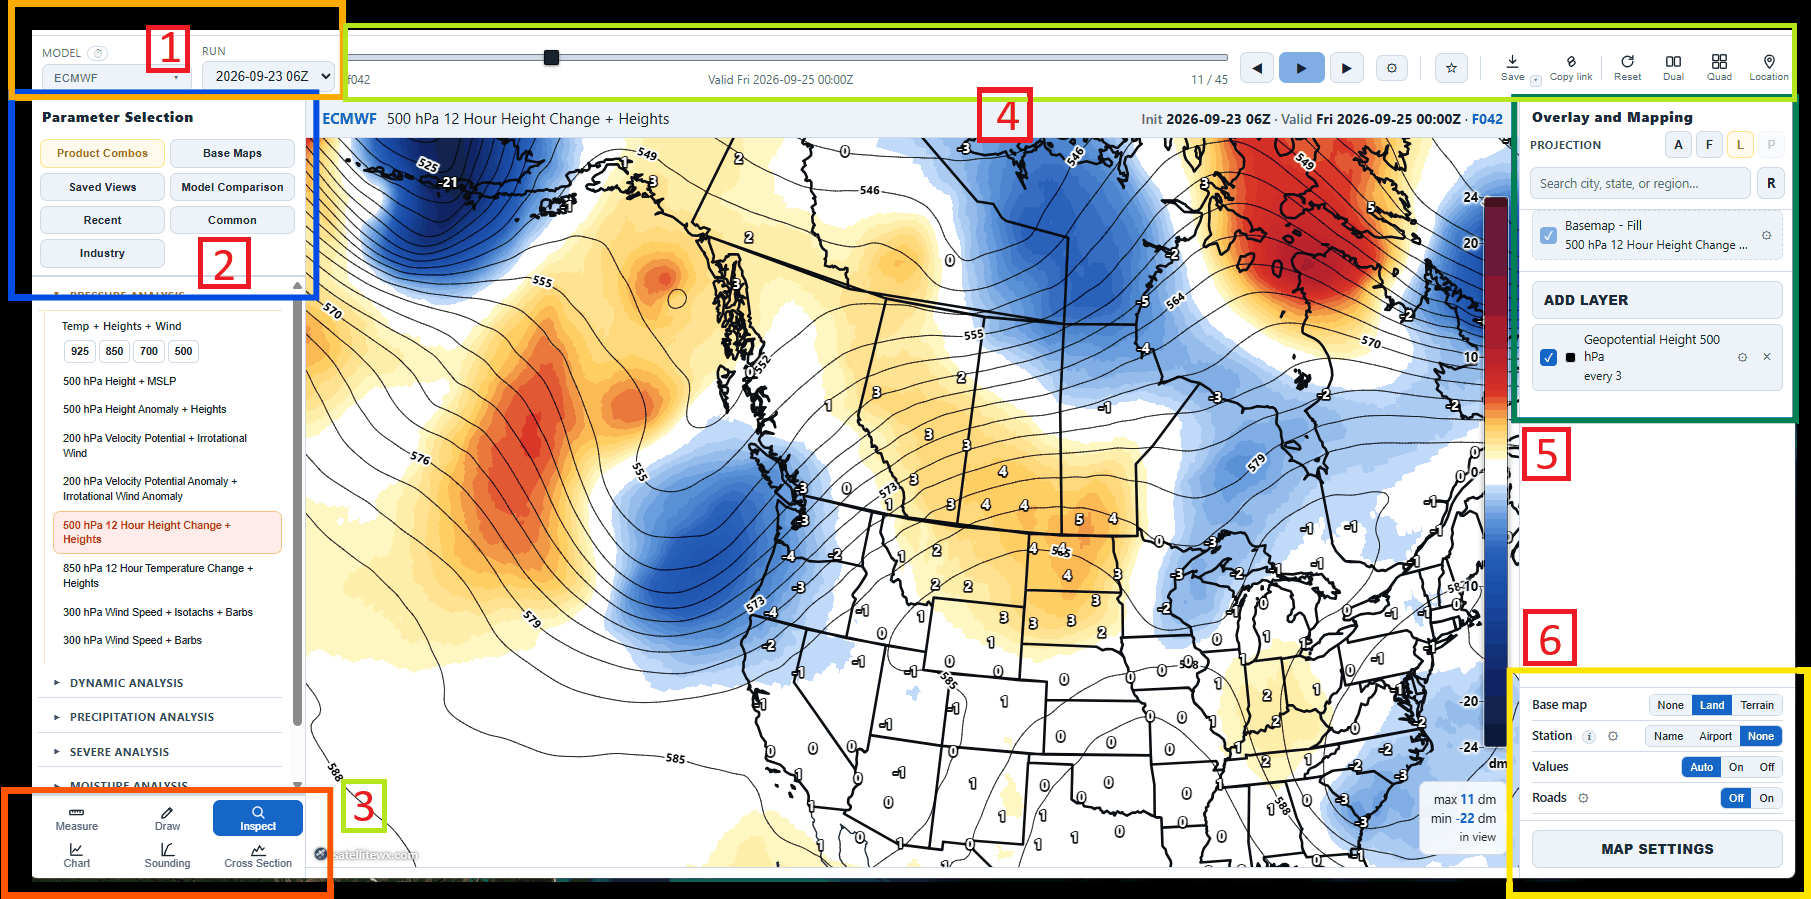
500 hPa height anomaly and MSLP anomaly — the pattern behind the sensible weather.
Zonal, meridional and velocity-potential fields at 200 and 850 hPa, as streamlines or barbs.
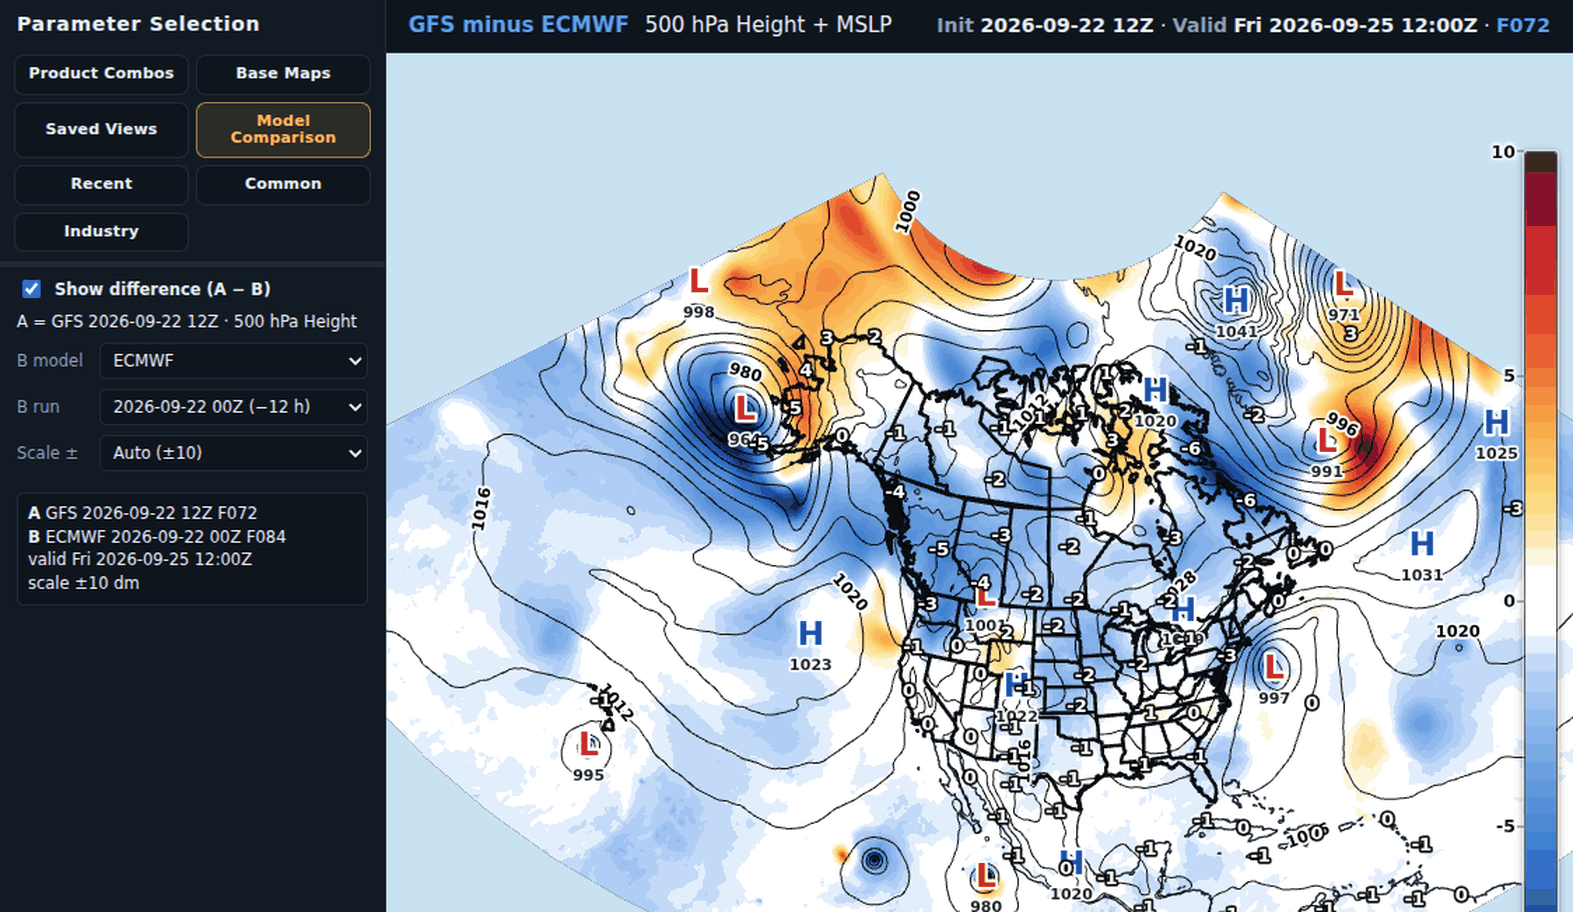
Difference one model against another on the same field, or overlay them on the same map.
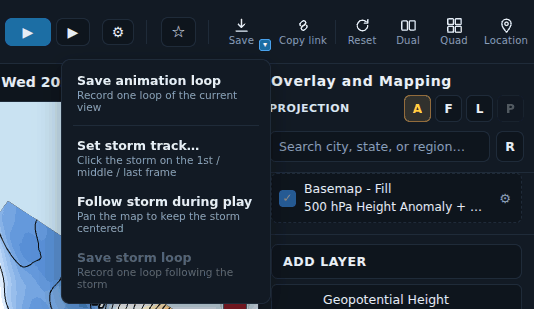
Play the run forward month by month, then save the loop as an animation or grab any single frame as an image.
Every model runs on a global grid. Jump straight to North America, Europe, Asia, the Pacific or either pole, or scroll to zoom anywhere in between — the domain buttons are shortcuts, not separate products.
Seasonal models are open to everyone right now, no account needed.
Create a free account to save favorites and carry them across web, iOS and Android. Sign in with a magic-link email, Google, or Apple — no separate registration step.
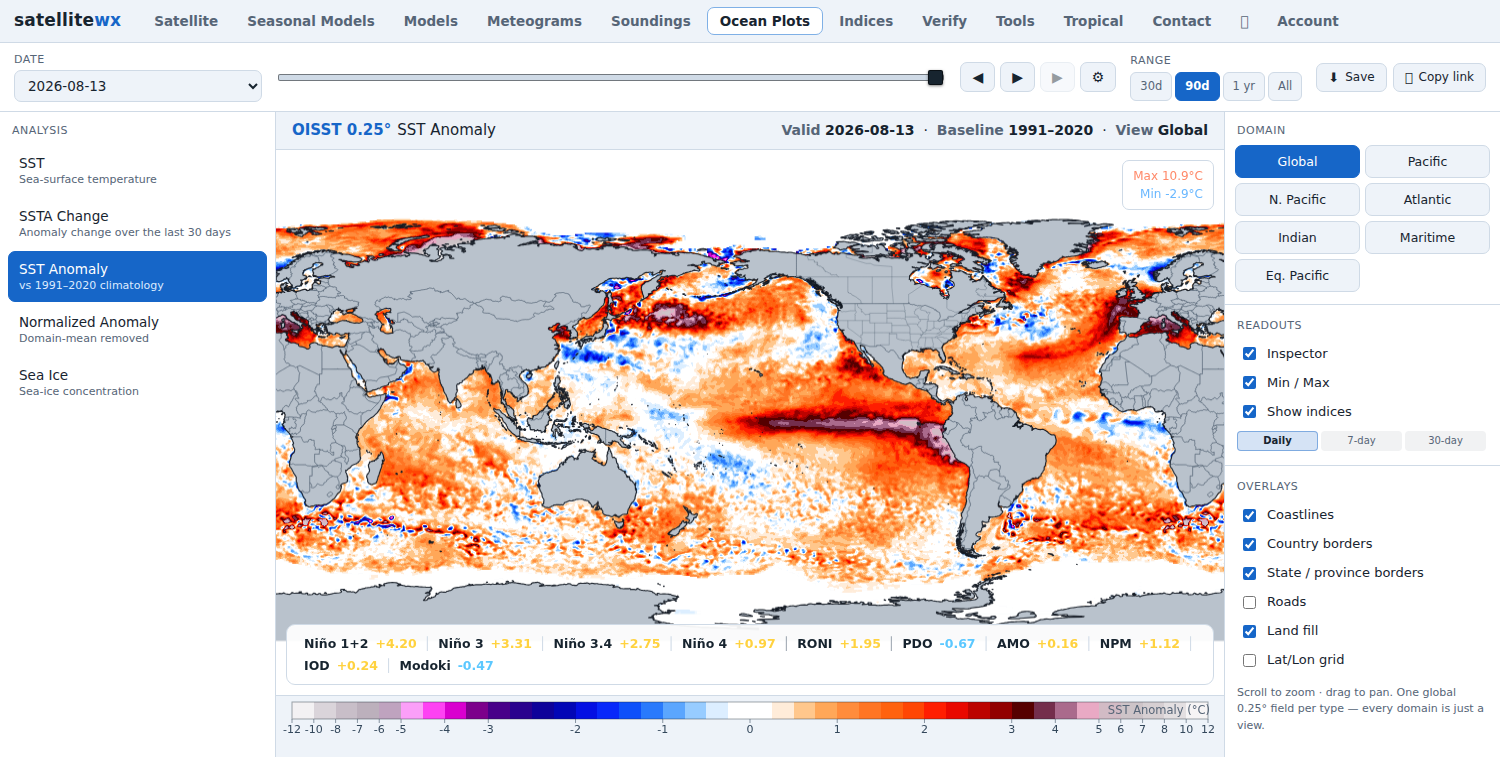
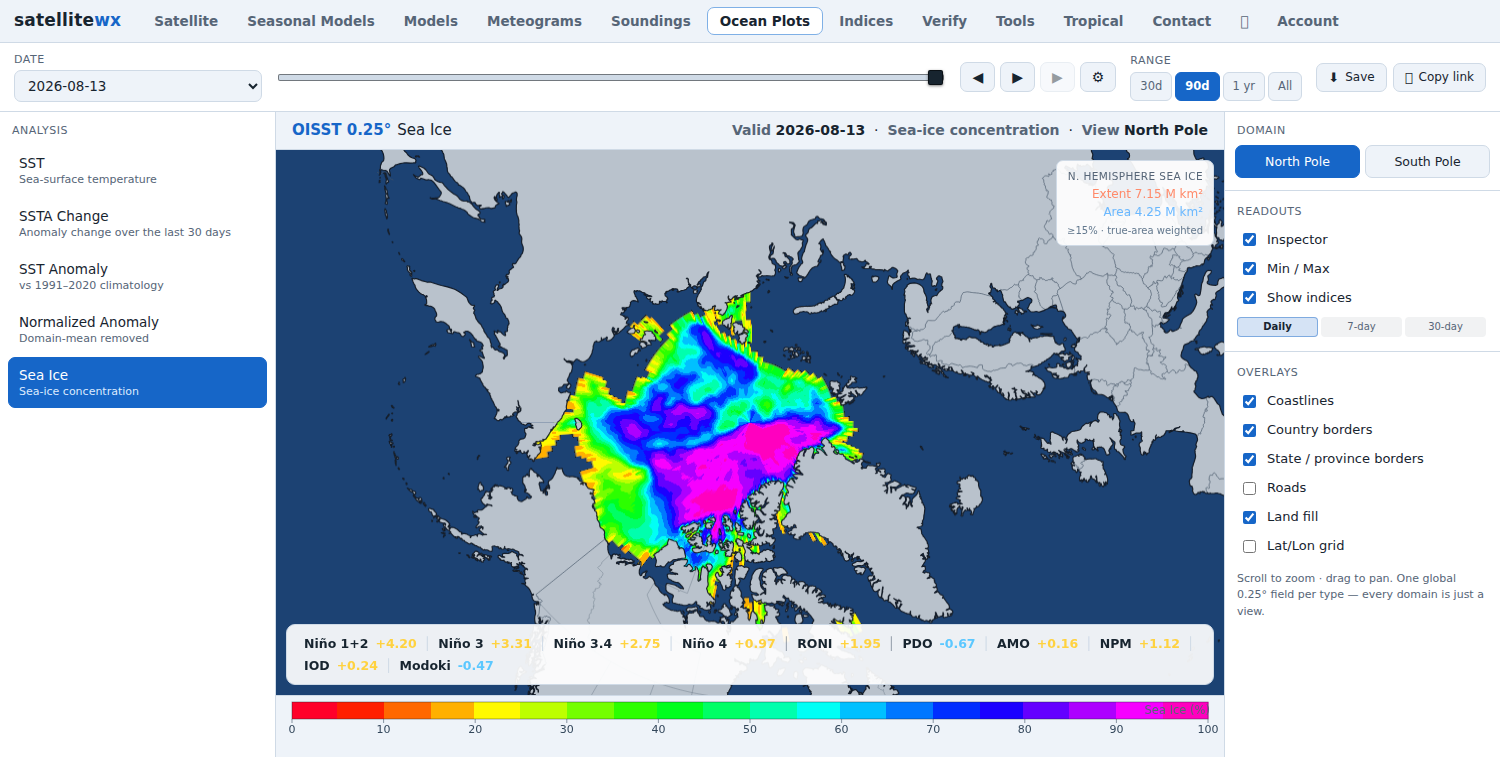
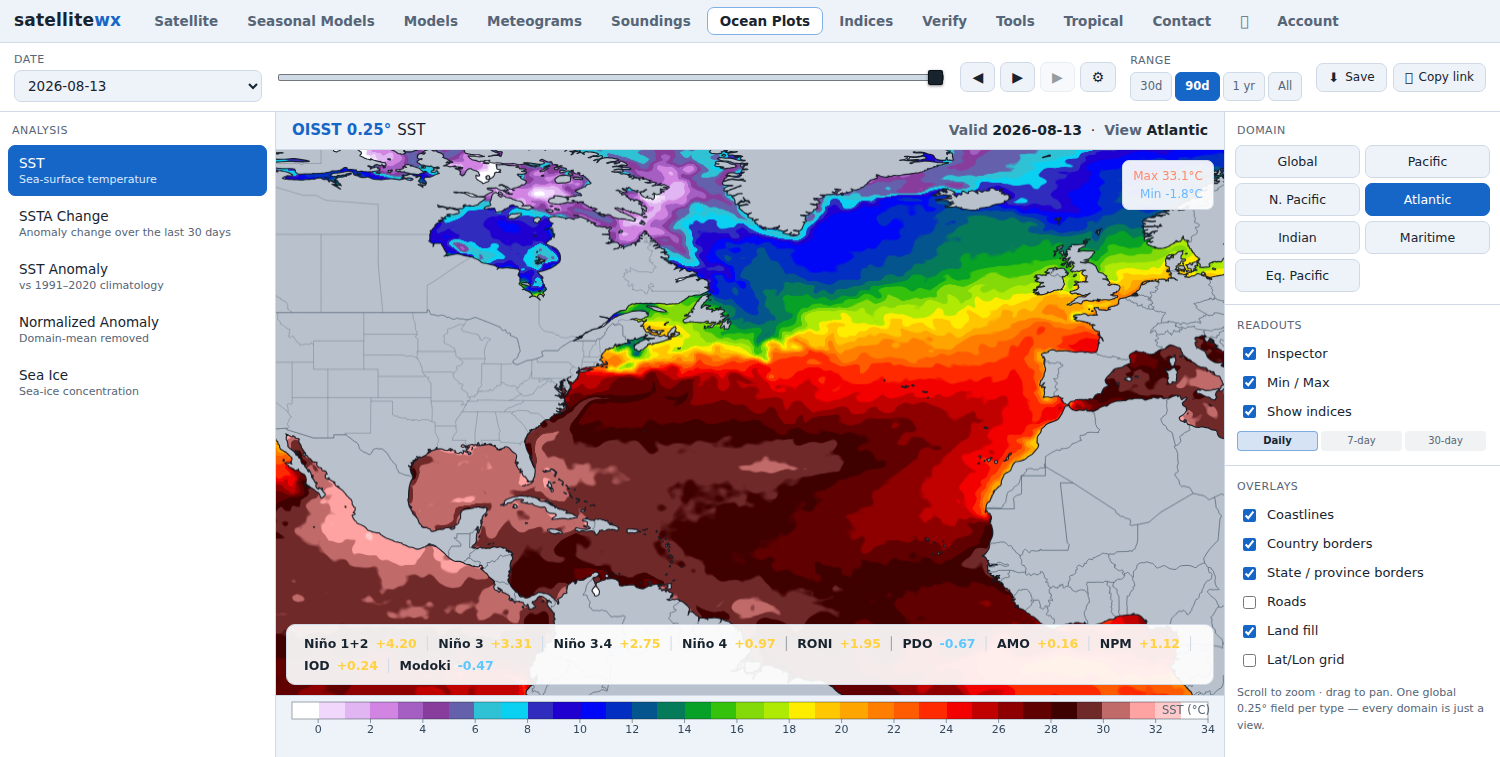
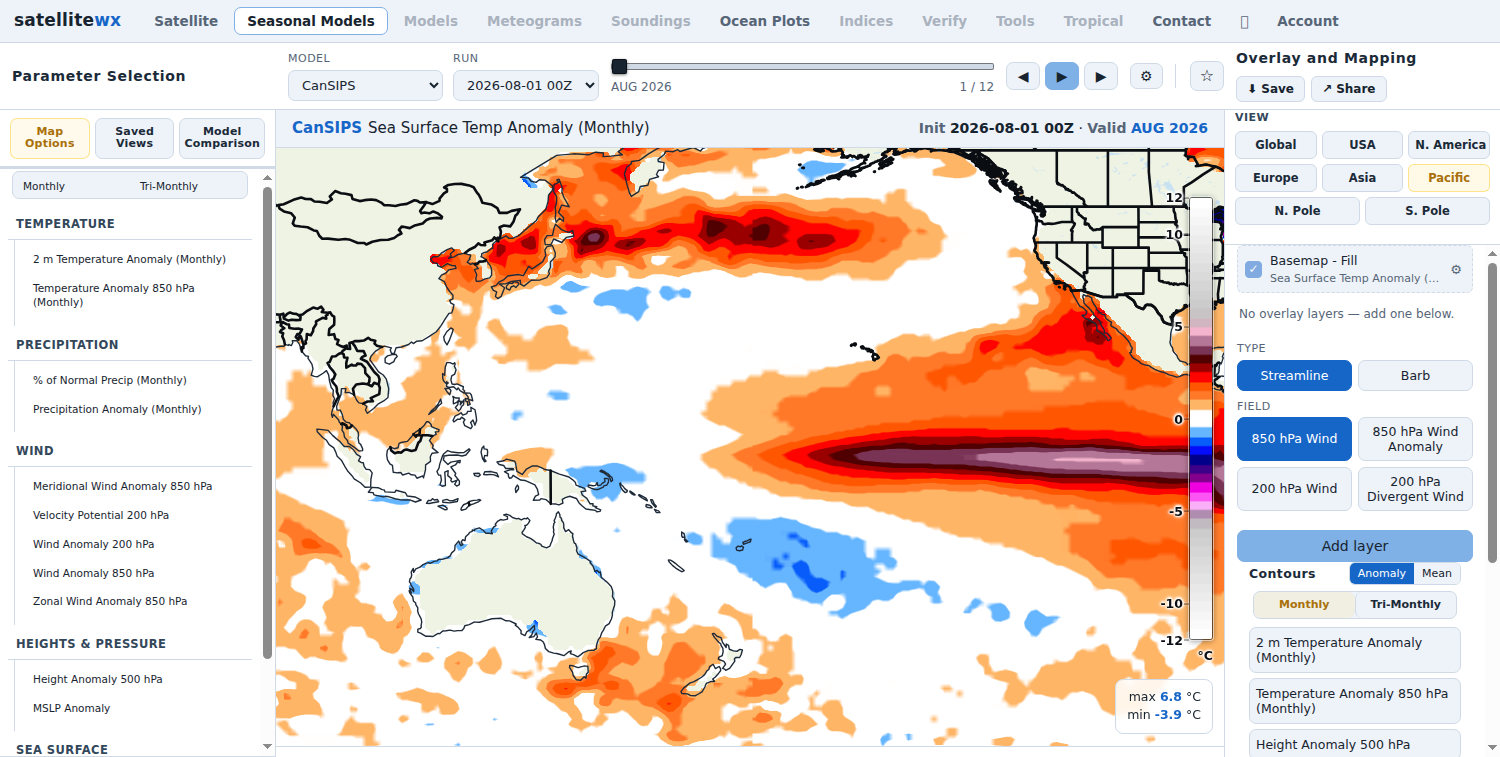
Global 0.25° SST, anomaly, normalized anomaly and sea-ice — plus the climate indices that drive a seasonal forecast, computed off the same field you're looking at.
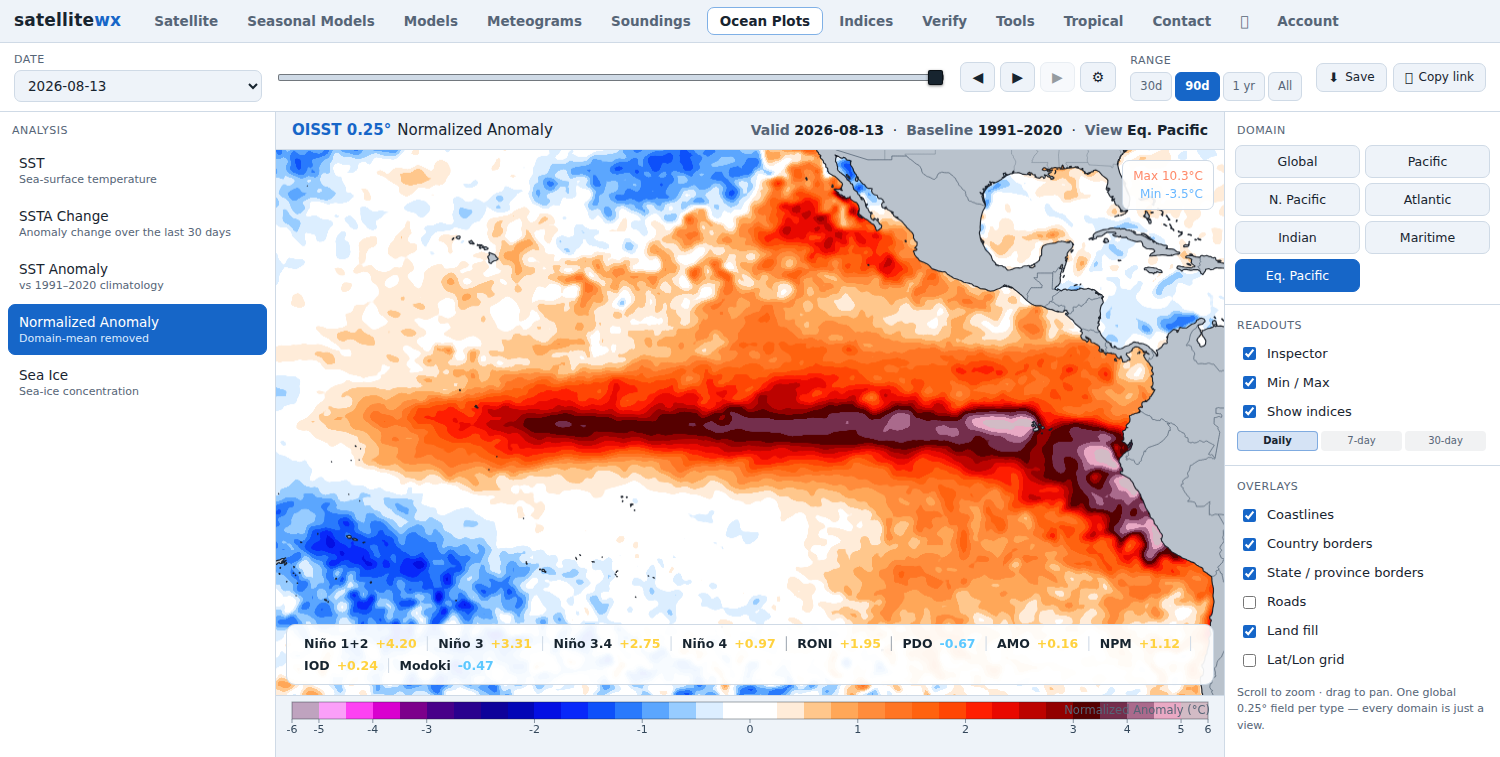
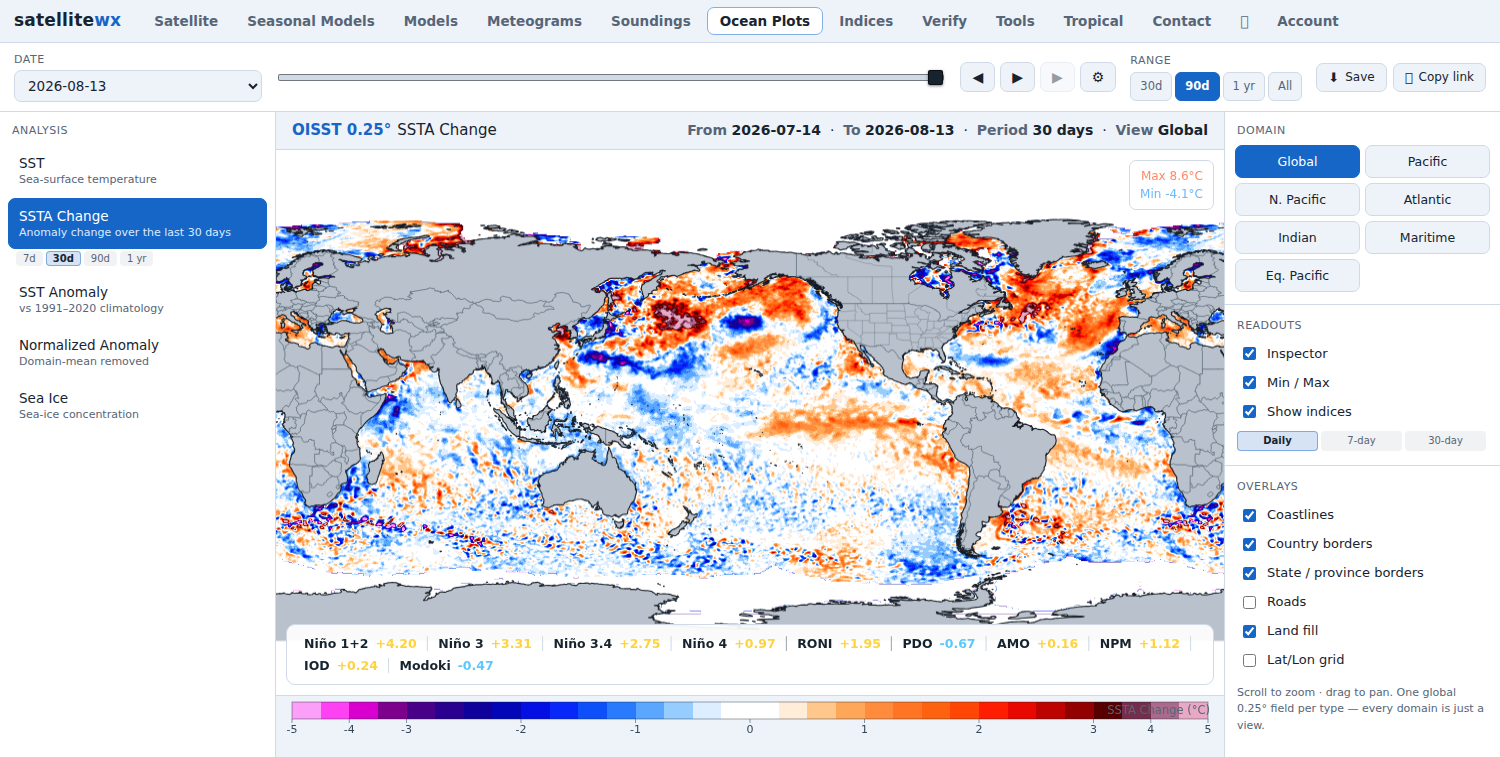
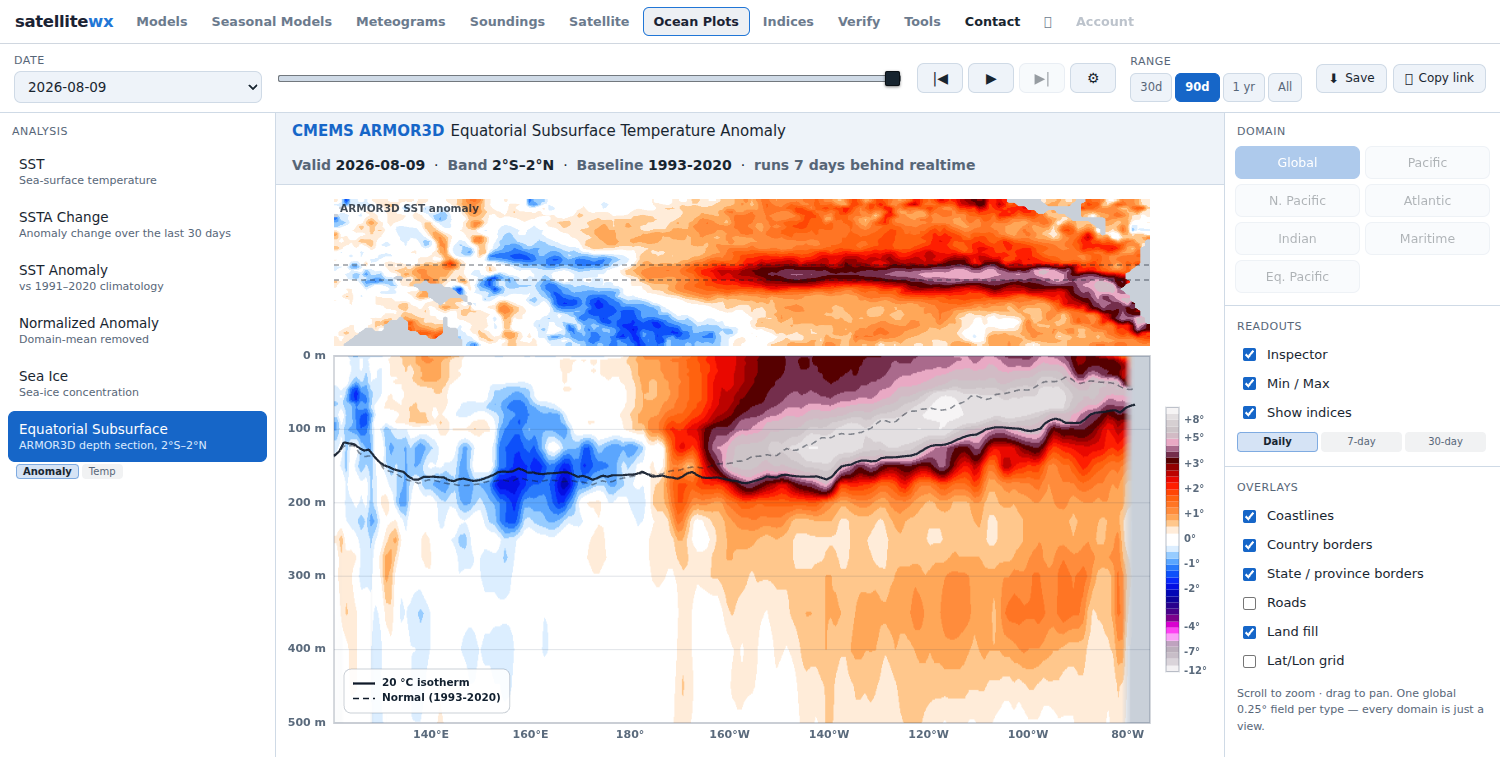
SST, anomaly vs 1991–2020, 30-day anomaly change, domain-mean-removed normalized anomaly, sea-ice concentration, and an equatorial subsurface depth section.
Difference any date against 30, 60 or 90 days back — with the true value under the cursor.
The ENSO and basin indices update with the field, so the number and the map can never disagree.
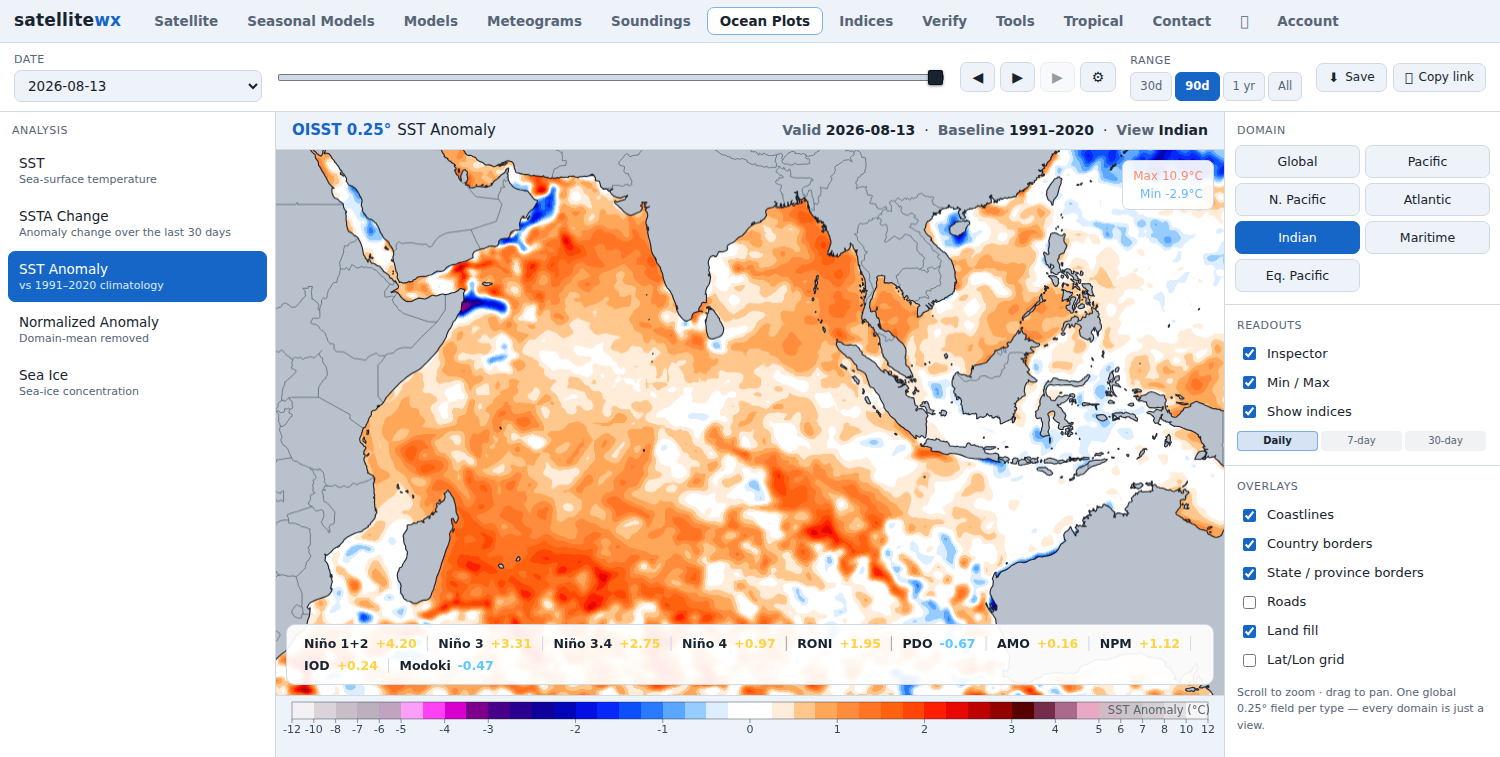
Global, Pacific, Atlantic, Indian, Maritime, Equatorial Pacific and both poles.
Play a year of daily fields as a loop, then save the animation or grab any single day as an image.
One global 0.25° field per type, updated daily, with about a year of history behind it. Global, Pacific, Atlantic, Indian, Maritime, Equatorial Pacific and both poles are views of that same field — scroll to zoom anywhere.
Ocean plots are open to everyone right now, no account needed.
Create a free account to save favorites and carry them across web, iOS and Android. Sign in with a magic-link email, Google, or Apple — no separate registration step.
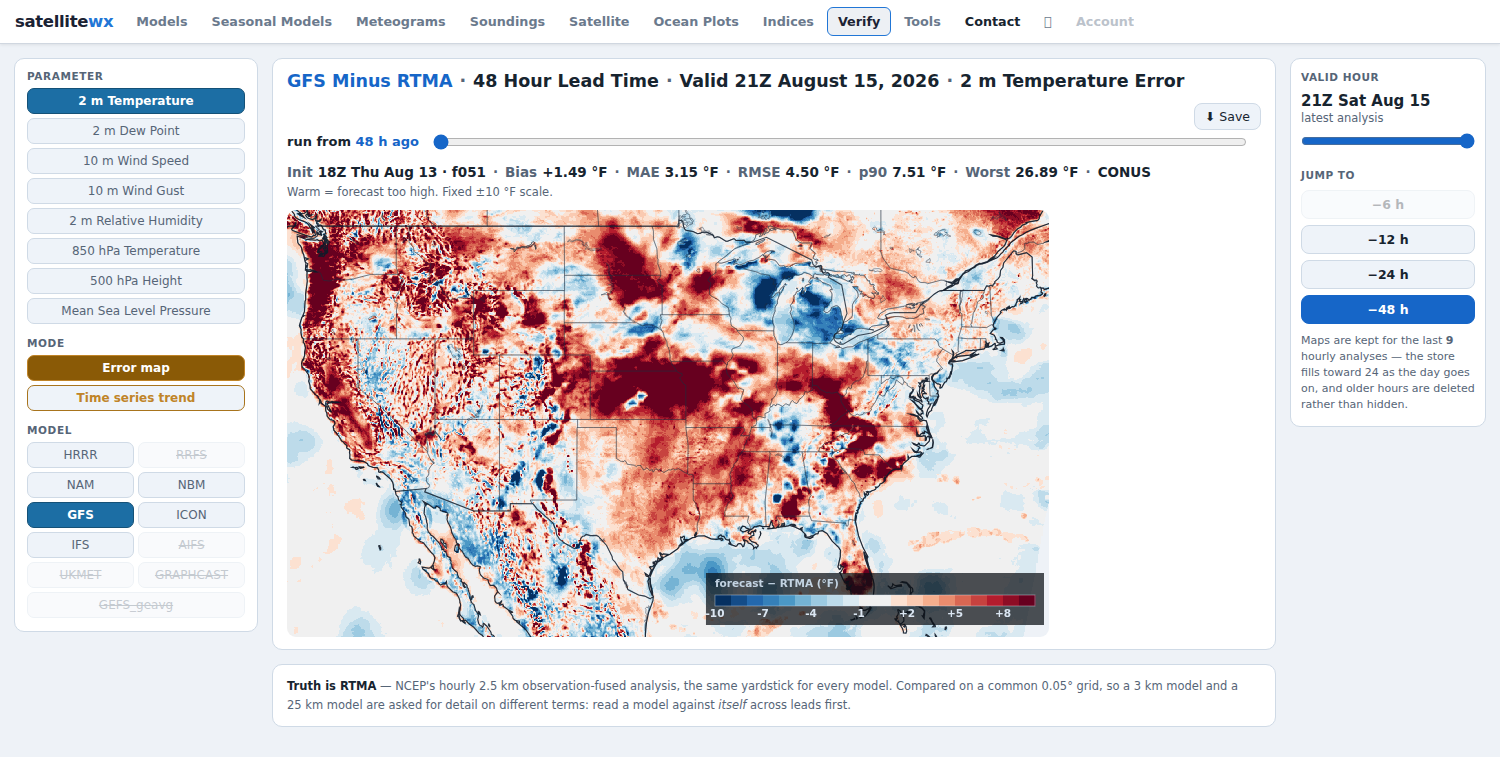
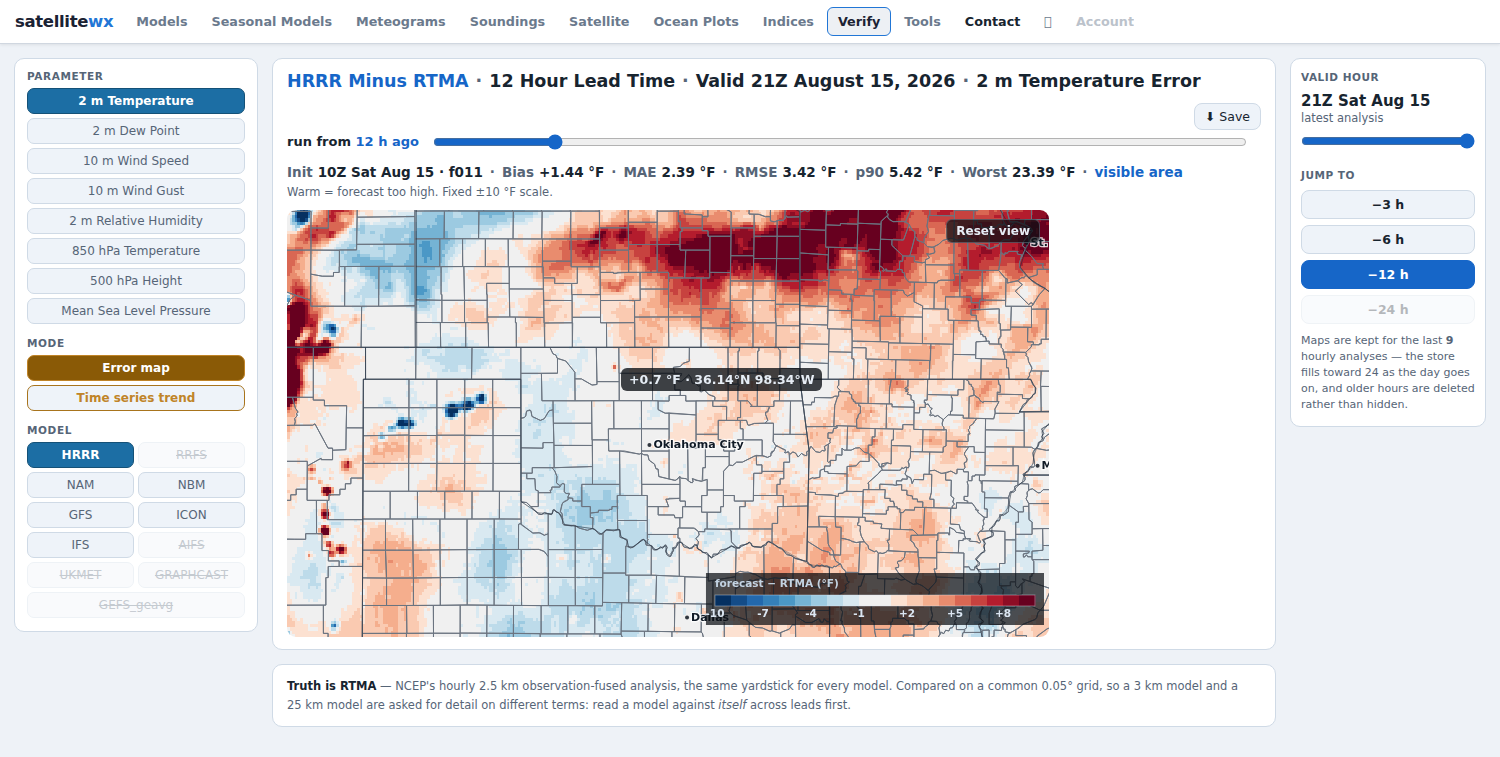
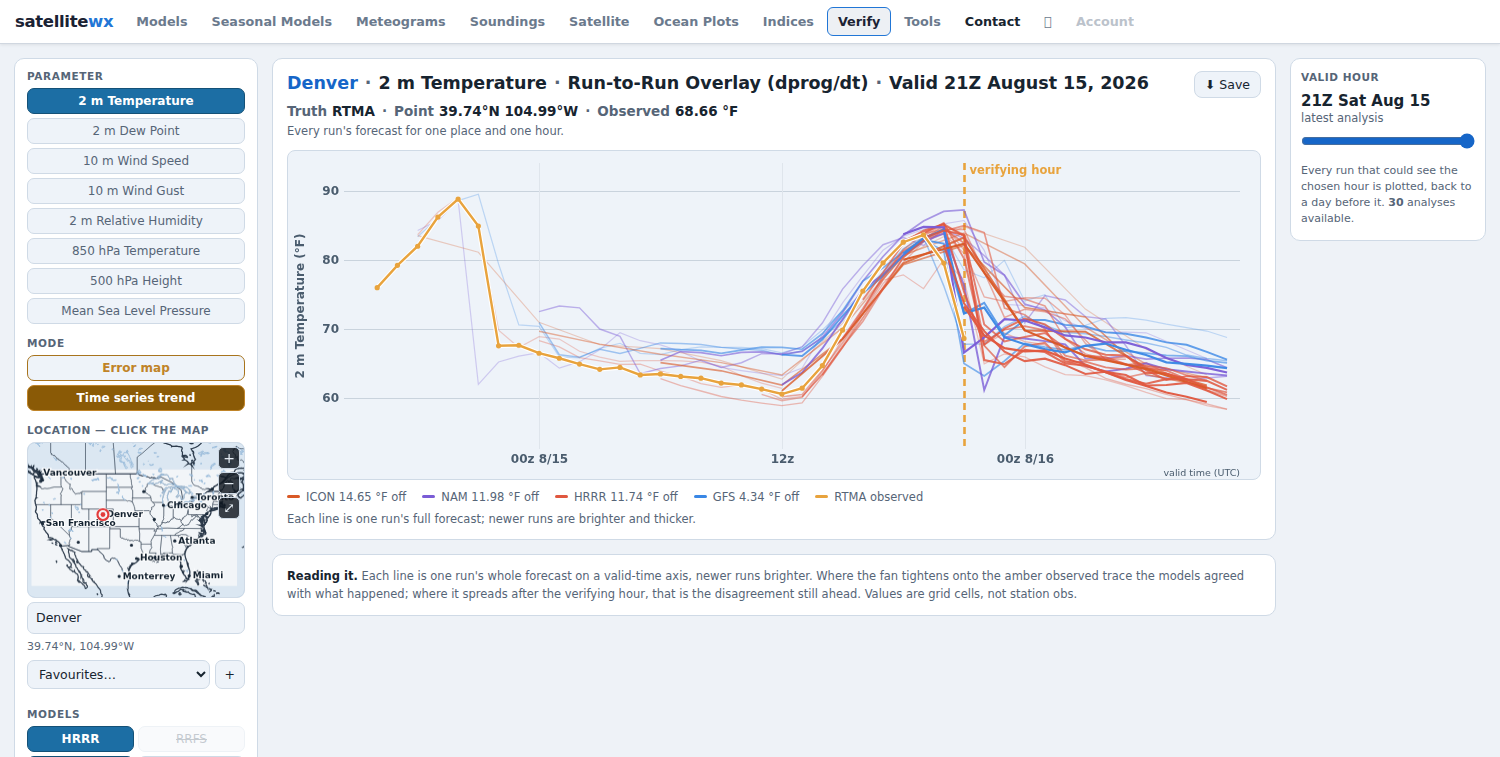
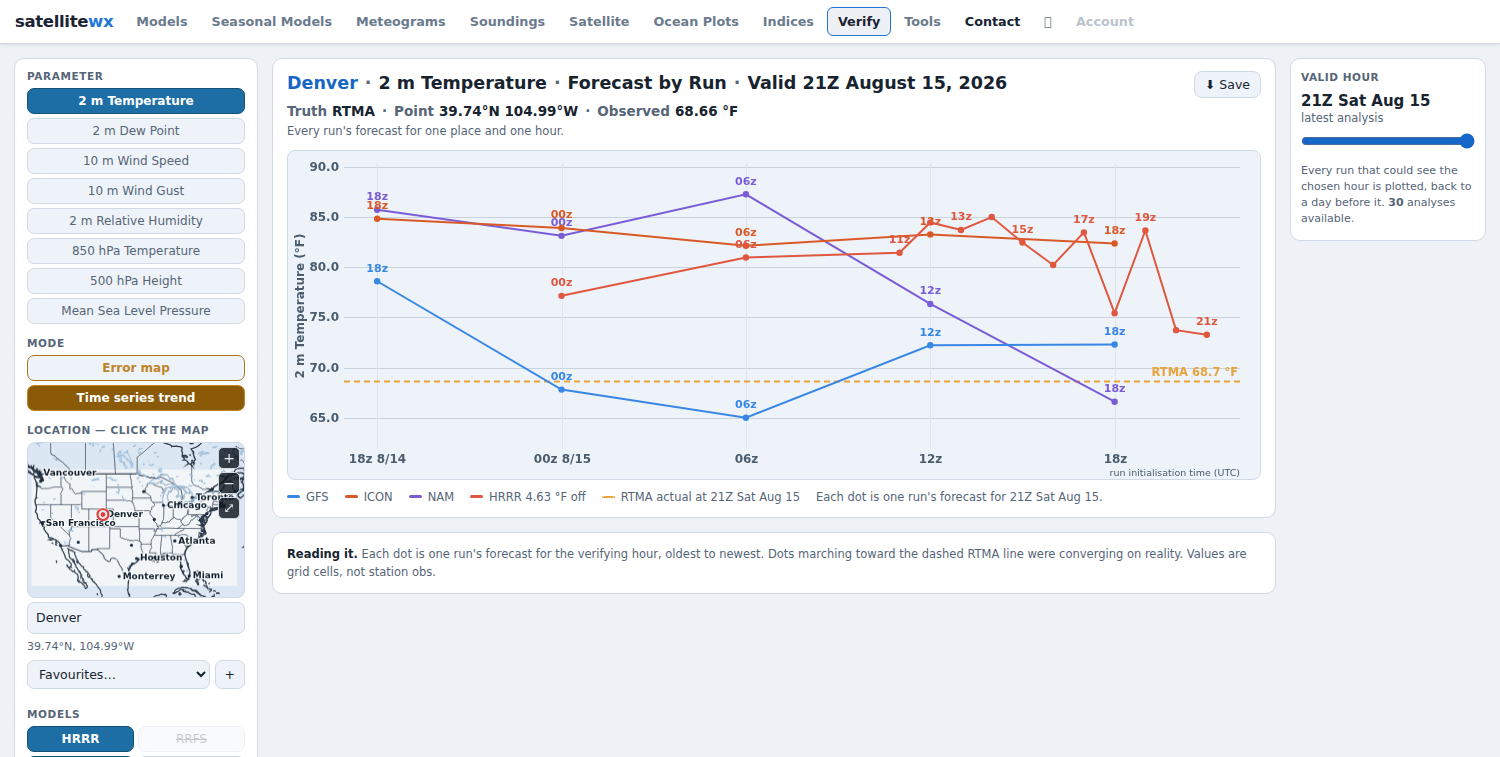
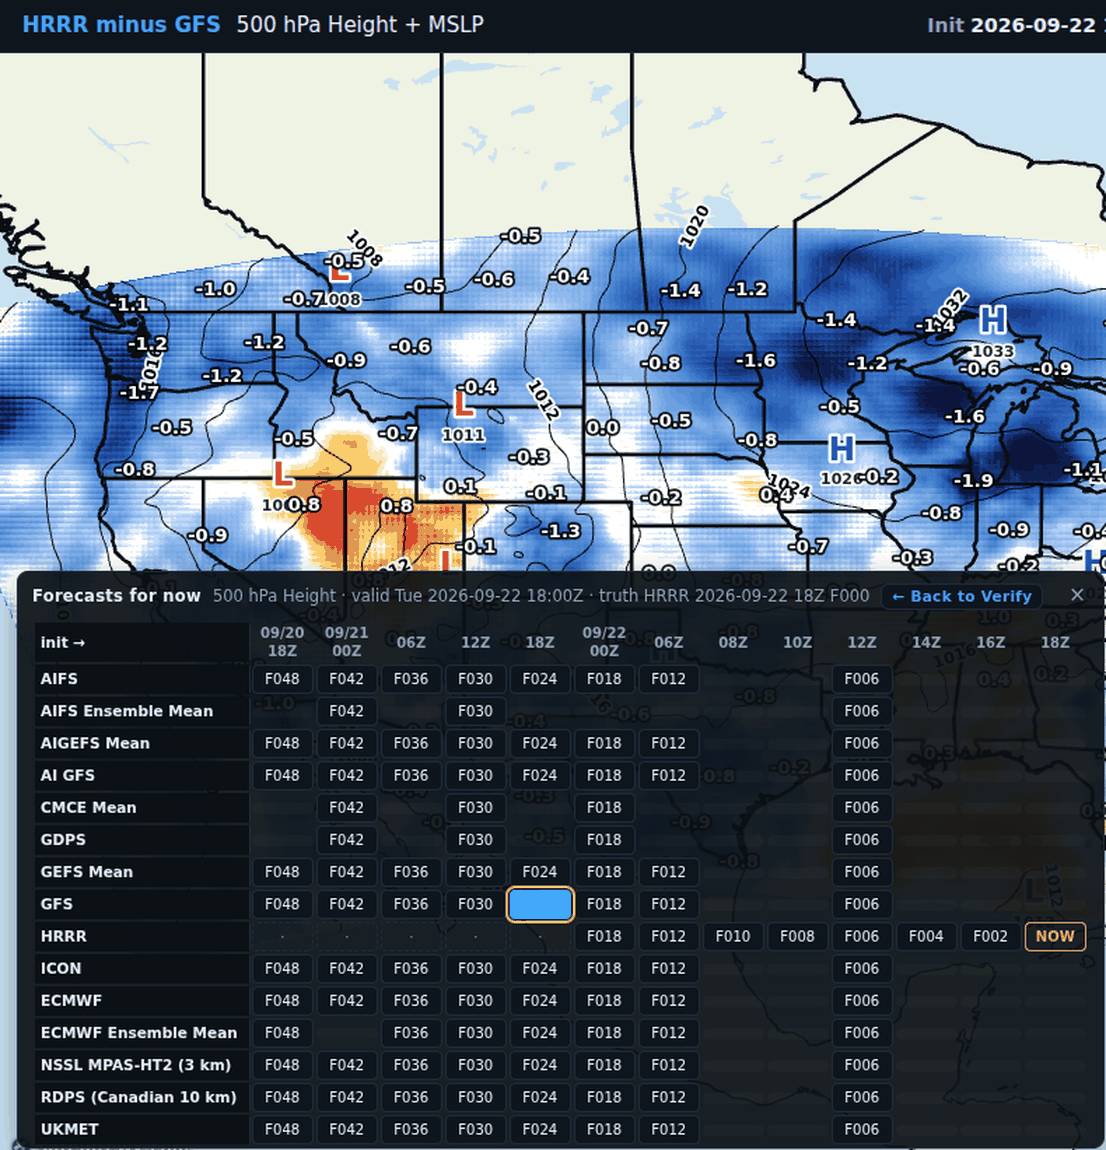
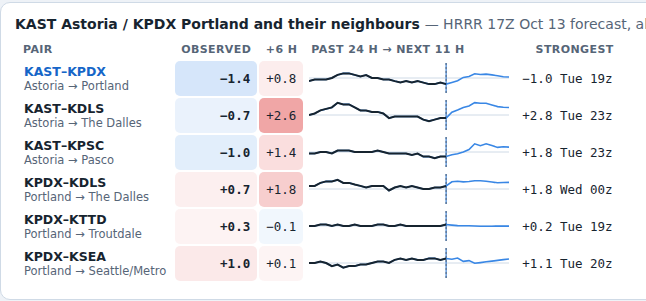
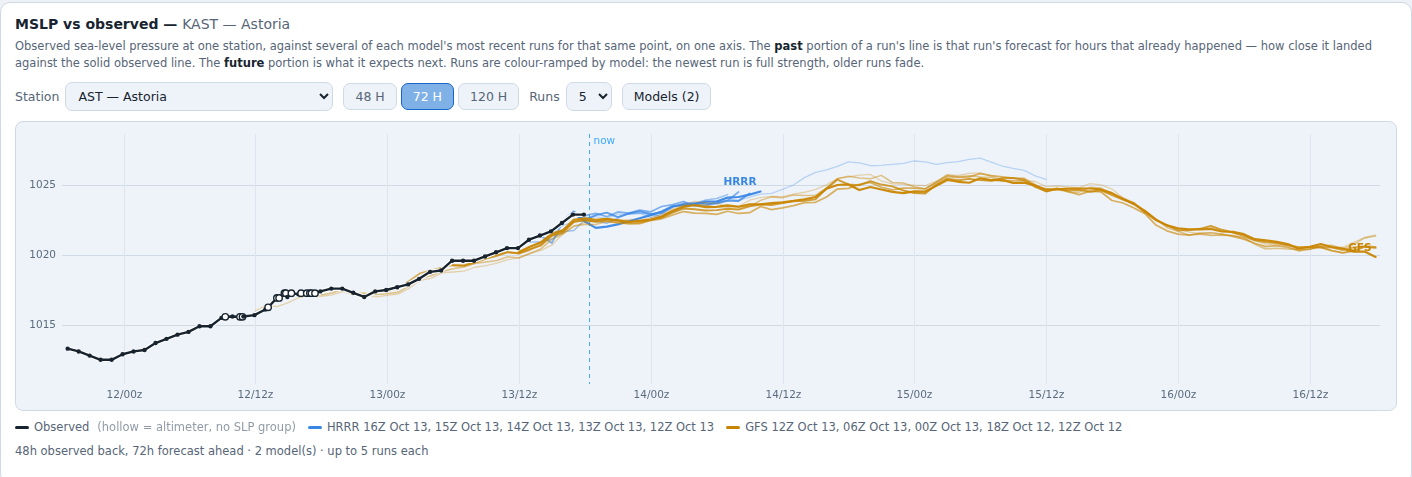
Compare model forecasts against what actually happened every hour. This is done by differencing NCEP's 2.5 km RTMA analysis against the forecast. Error maps for 8 parameters across multiple models are created, as well as run-by-run trends for every point in the CONUS.
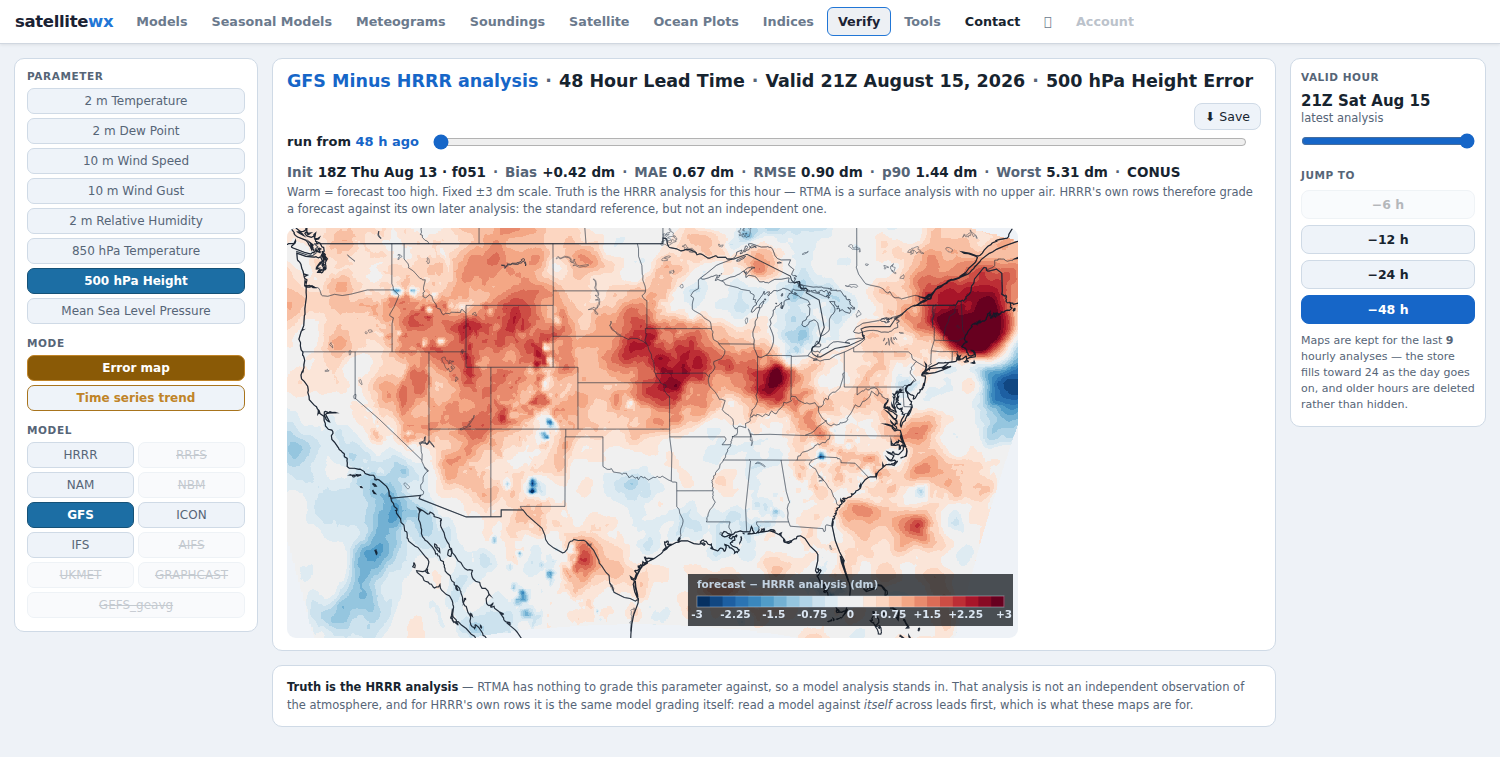
Forecast-minus-RTMA for 8 surface and upper-air parameters and 6 models, rebuilt every hour on a common 0.05° CONUS grid.
The same verifying hour from runs launched 1 to 48 hours earlier — watch the error grow with lead.
Bias, MAE, RMSE and p90 recompute for exactly the area on screen, not the whole country.
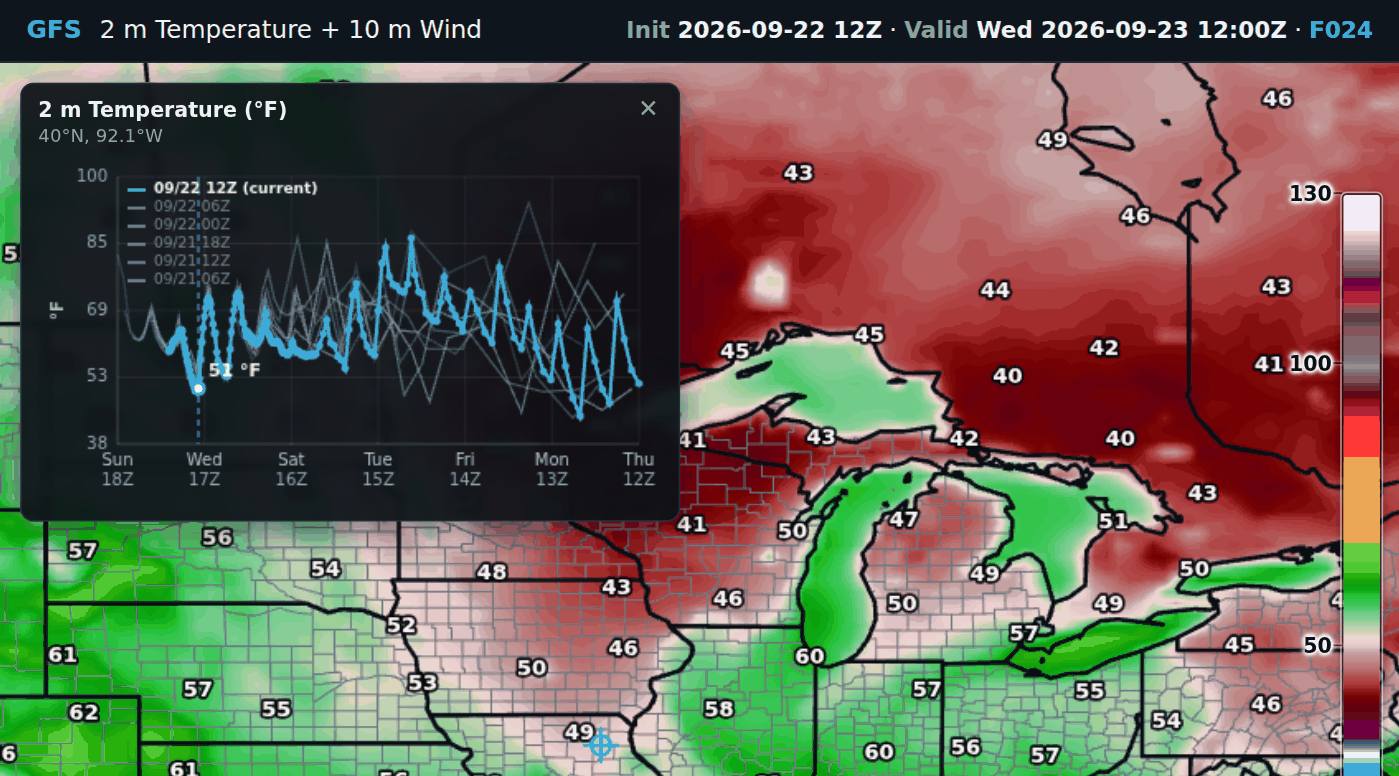
Run-to-run overlay and forecast-by-run views for any of 400 cities — or any point you click — across 10 models.
Step back through the day's hourly analyses to see how the models handled this morning.
The whole view lives in the URL, and Save exports the map with its zoom and its numbers.
Truth is RTMA — NCEP's hourly 2.5 km observation-fused analysis — for the surface fields, and the HRRR analysis for 850 hPa temperature, 500 hPa height and MSLP, labelled as such on every plot. The newest verifying hour lands roughly an hour behind real time; maps are kept through the day and point trends reach back 30 analyses.
Verification is open to everyone right now, no account needed.
Create a free account to save favorites and carry them across web, iOS and Android. Sign in with a magic-link email, Google, or Apple — no separate registration step.
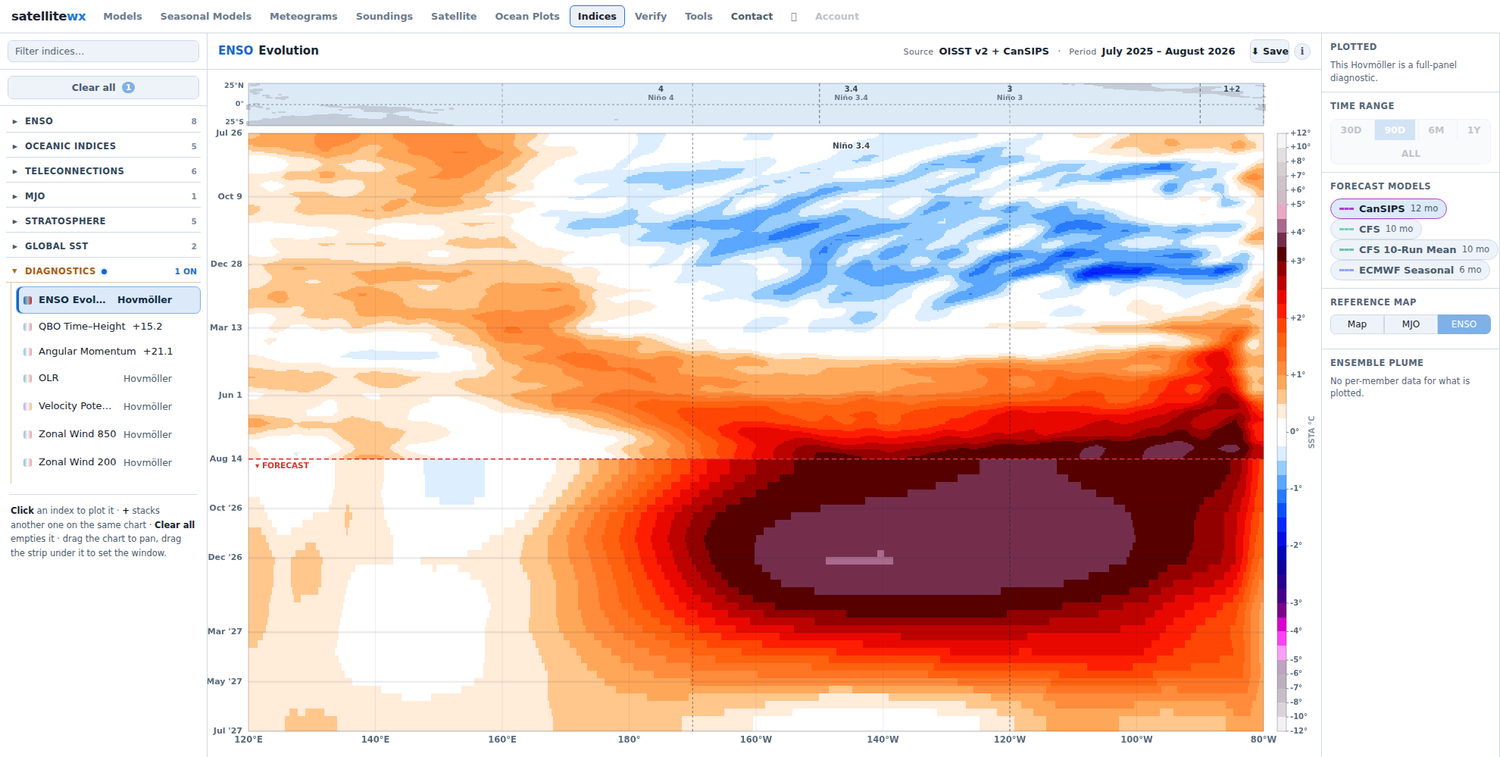
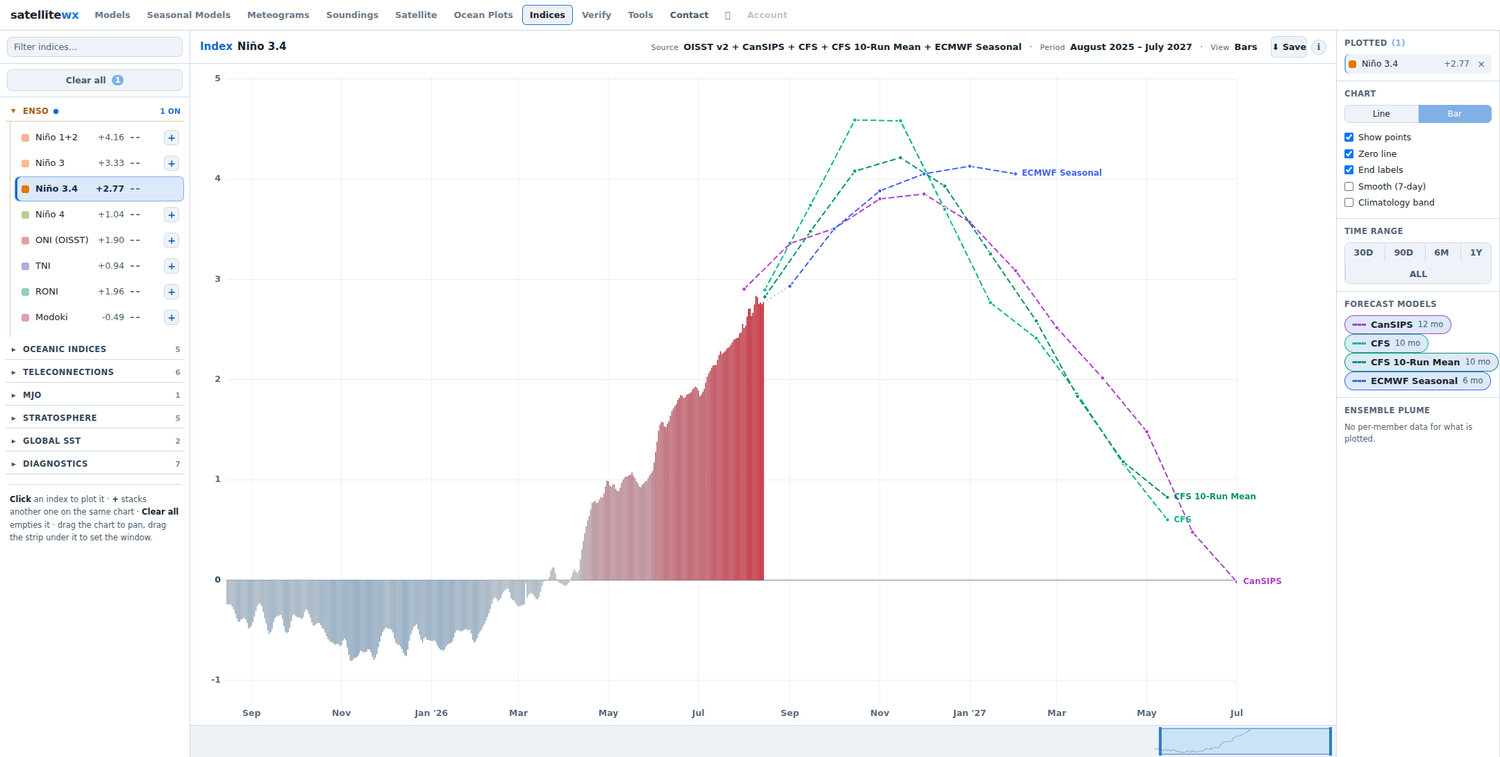
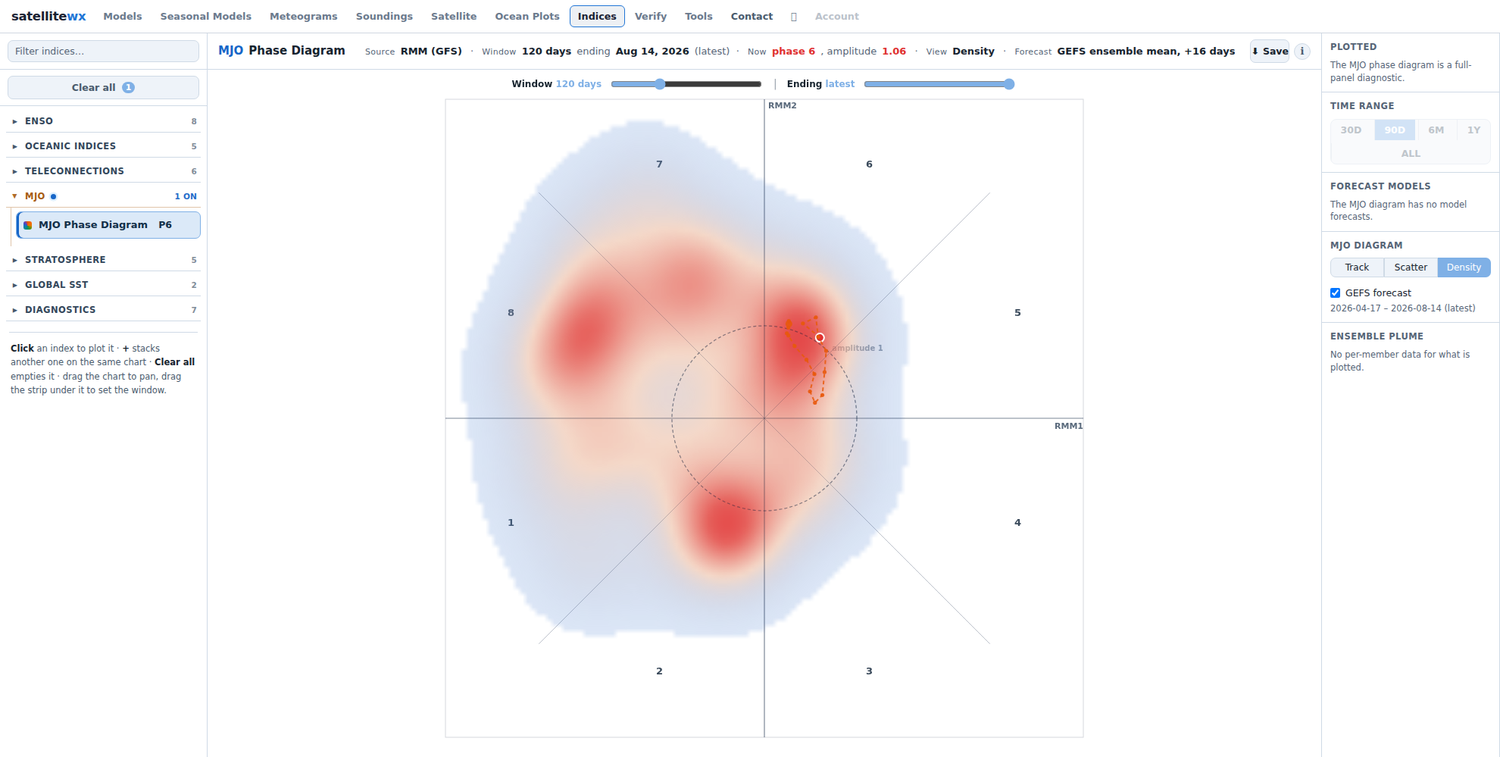
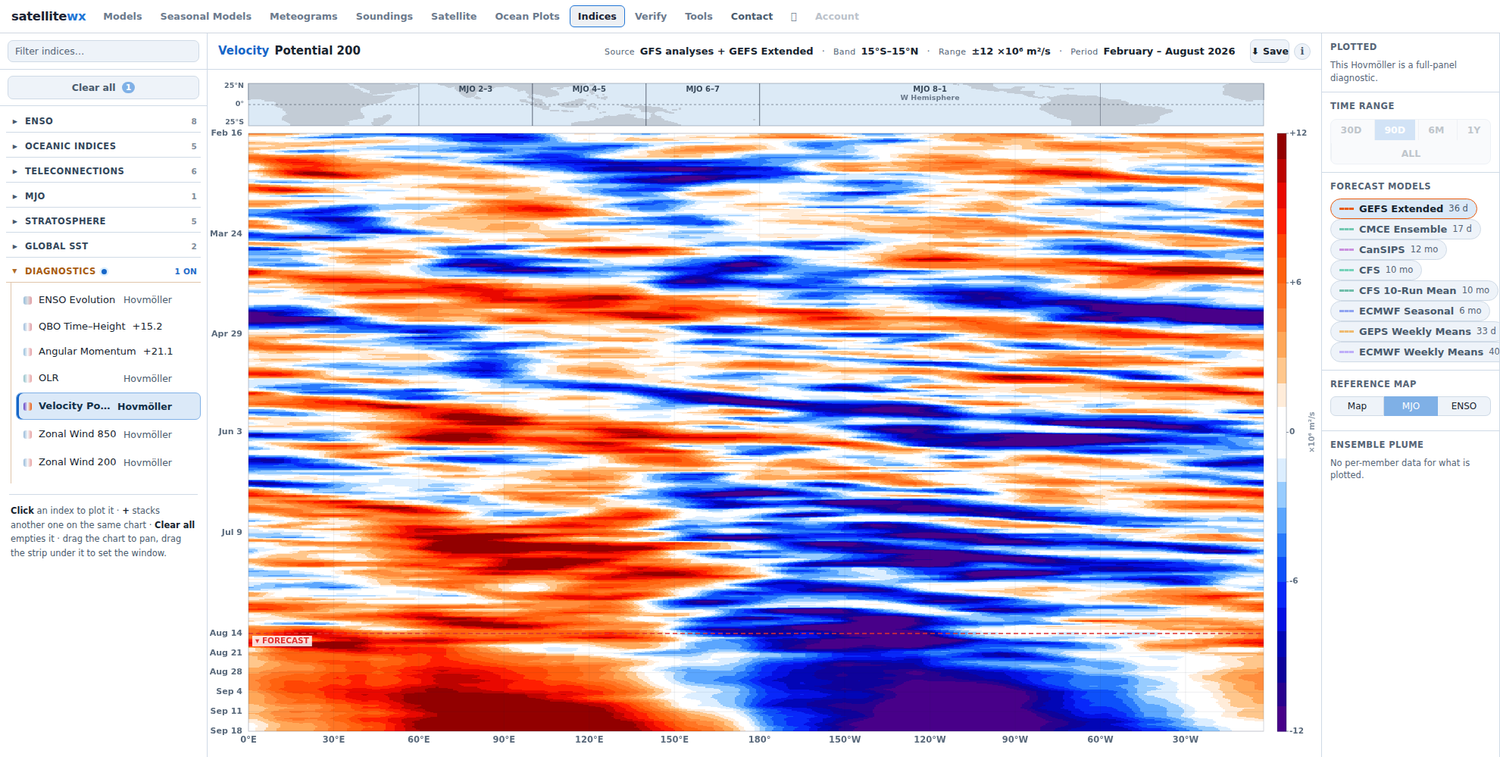
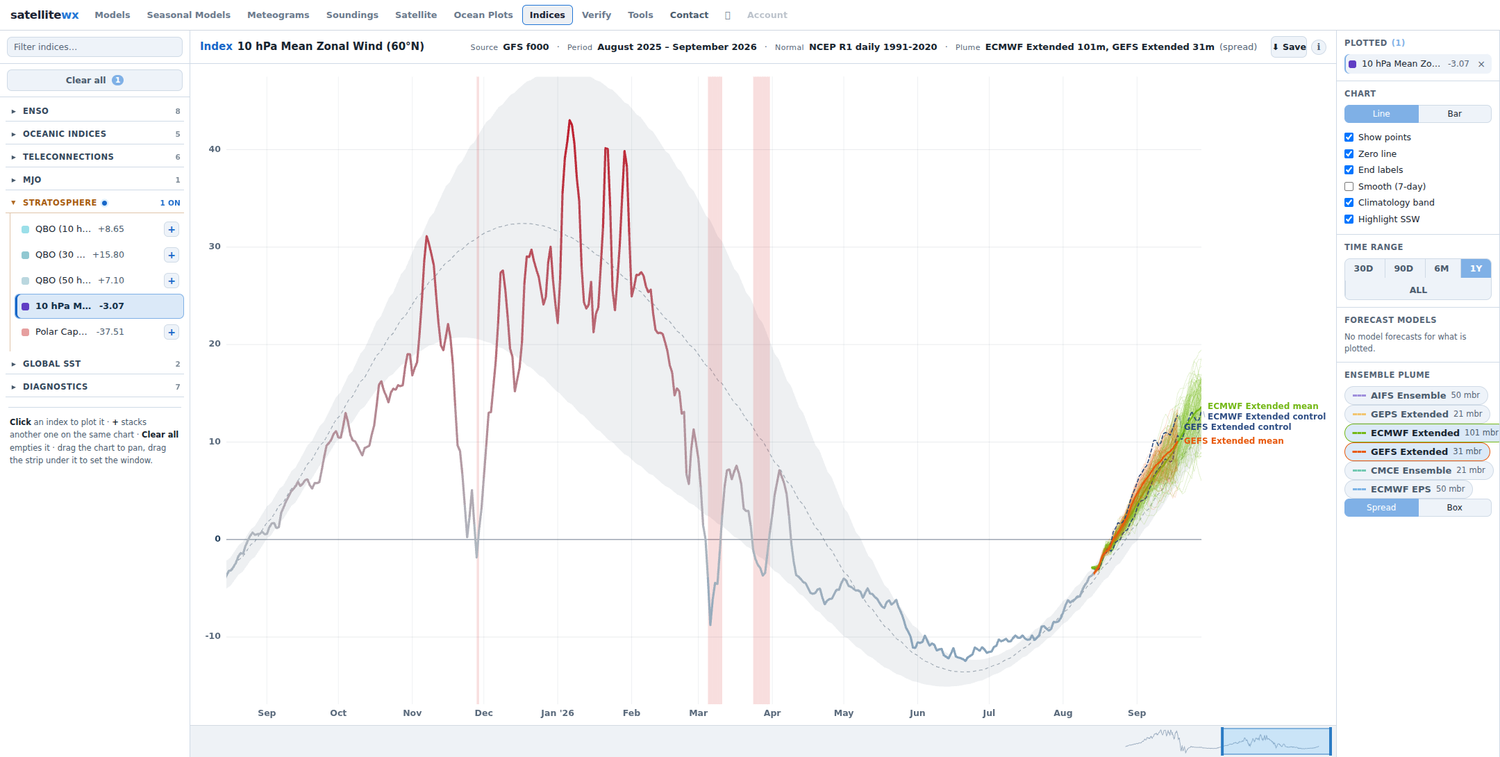
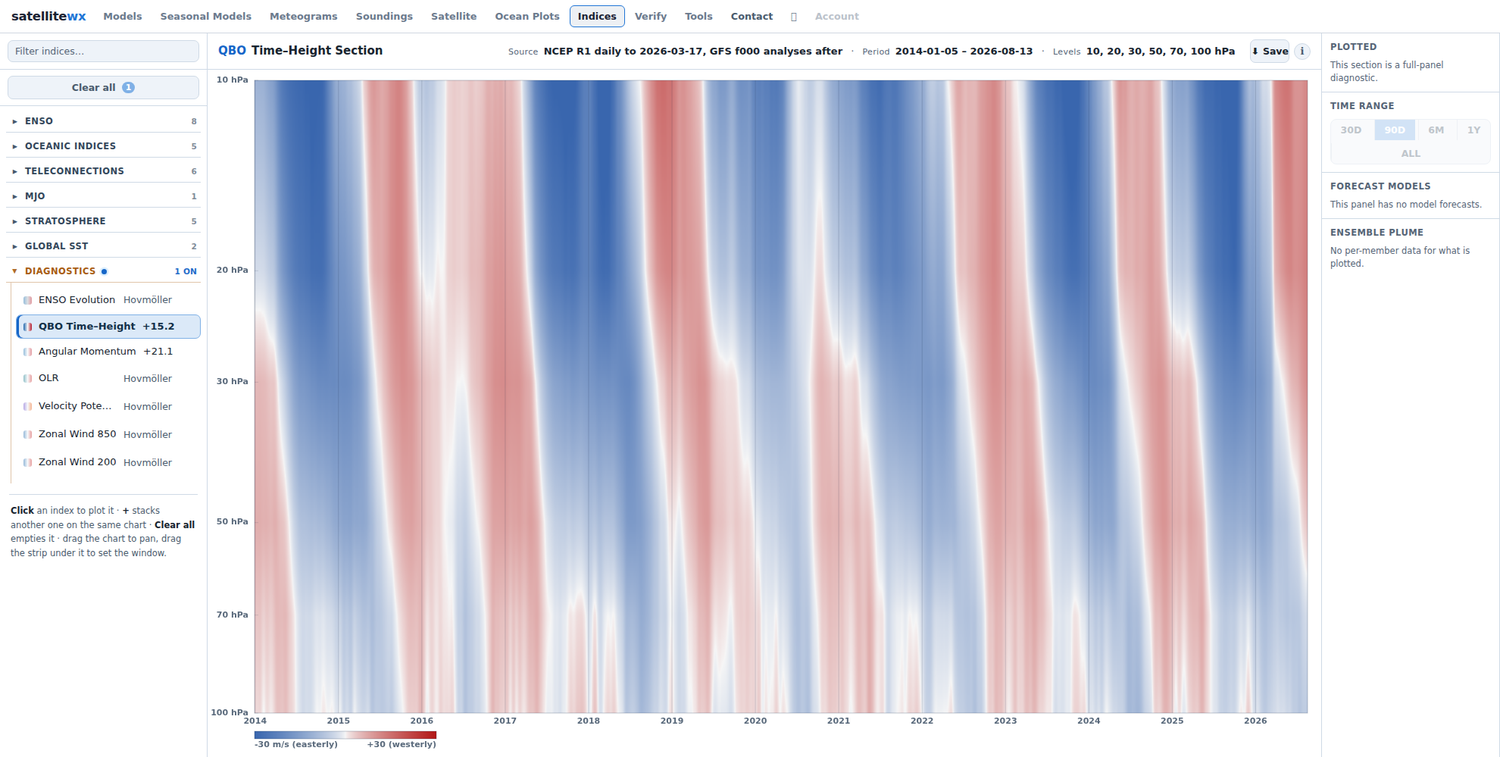
Daily climate and teleconnection indices computed straight from OISST and NCEP analyses — with seasonal and subseasonal model forecasts appended, full ensemble plumes, an MJO phase diagram, and Hovmöllers that carry observations into the forecast.
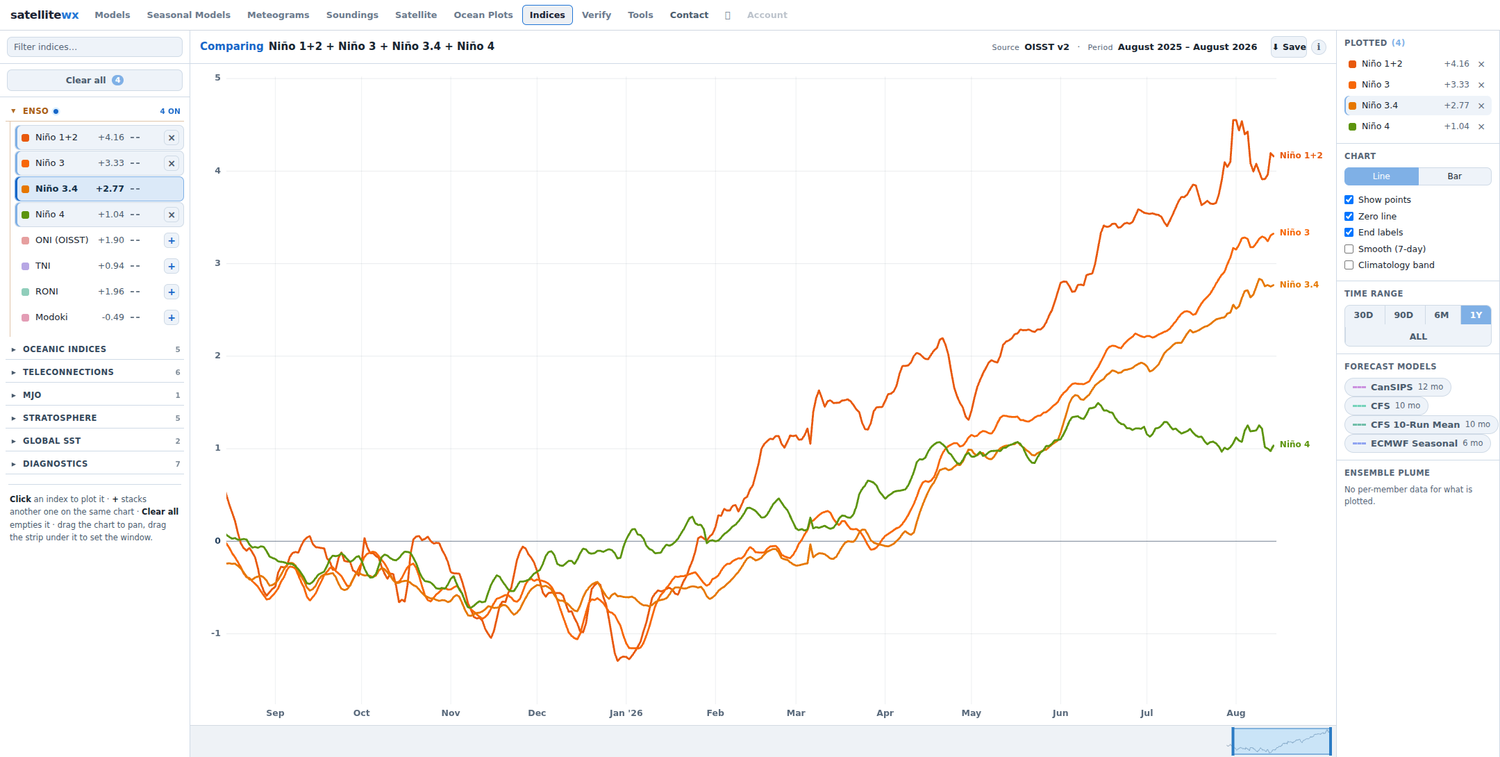
ENSO (Niño regions, ONI, TNI, RONI, Modoki), PDO, AMO, IOD, PMM, NAO, AO, PNA, EPO, WPO, AAO, QBO and polar-vortex metrics — computed in-house from OISST and NCEP analyses.
Dashed CanSIPS, CFS and ECMWF curves out to a year on the SST indices; extended-range models on the teleconnections.
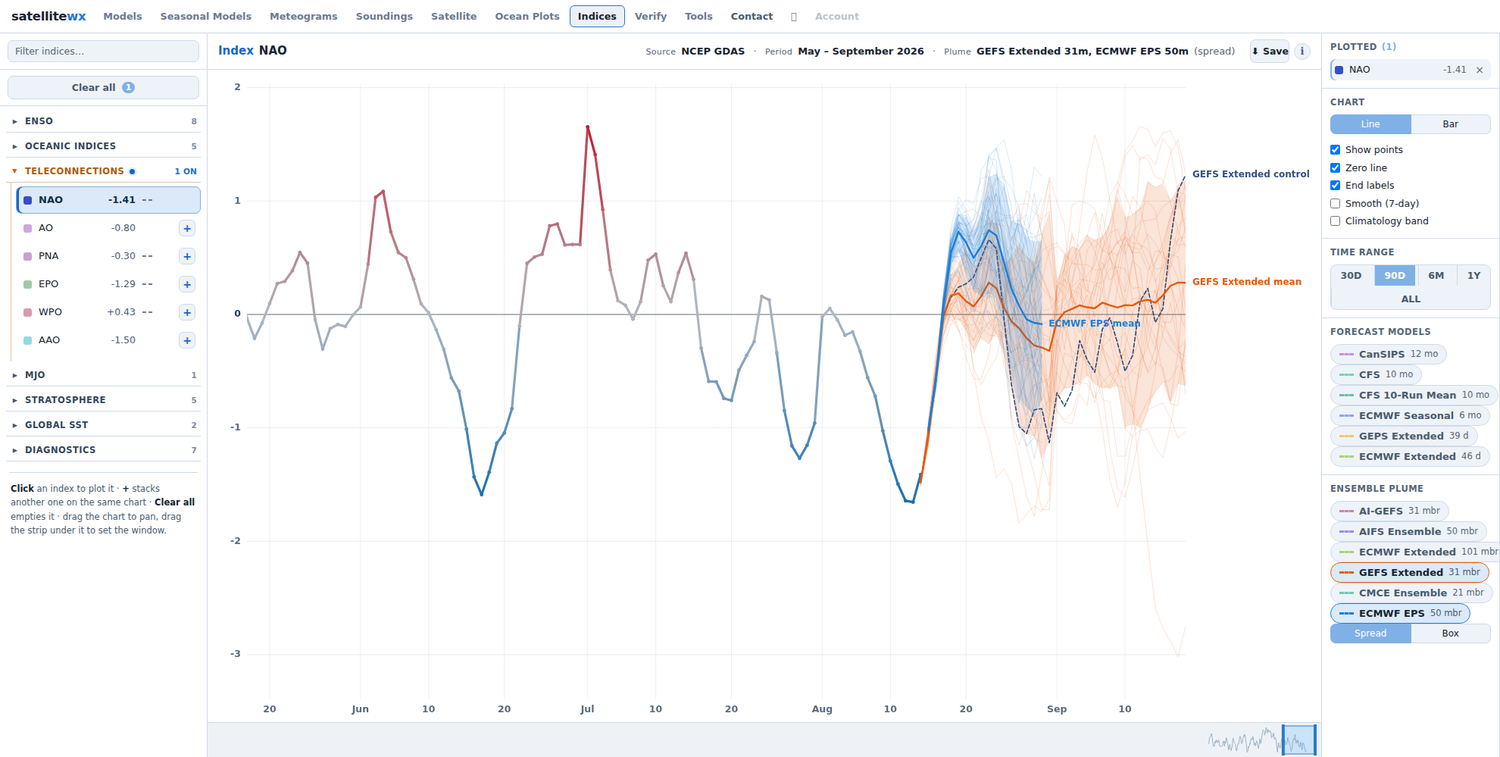
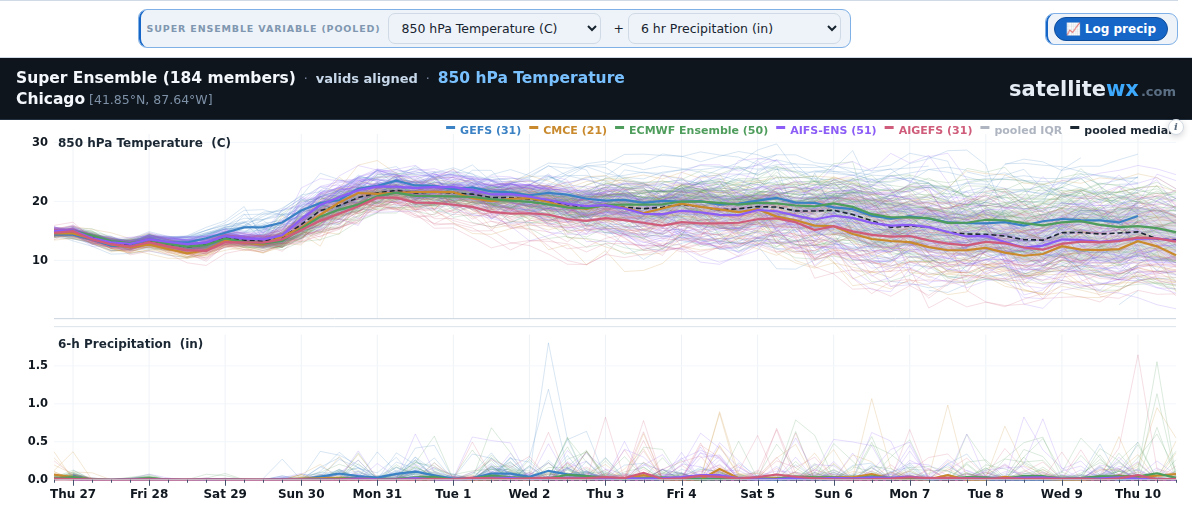
Six ensembles drawn member by member behind the mean and spread band, with a box-and-whisker alternative.
Phase-space track, scatter and density views, a sliding window to replay any stretch of the record, and the GEFS forecast track.
ENSO evolution — observations continuing straight into a seasonal model — plus OLR, velocity potential and zonal wind across the tropics.
Plot indices together, smooth them, add a climatology band — then share the exact view as a link or a branded image.
Ocean and ENSO indices come from NOAA's 0.25° OISST against a 1991–2020 baseline; teleconnections are daily projections onto CPC's own loading patterns; MJO and the stratosphere come from GFS analyses. Observations run through yesterday, refreshed daily, with forecasts reaching out to a year.
Indices are open to everyone right now, no account needed.
Create a free account to save favorites and carry them across web, iOS and Android. Sign in with a magic-link email, Google, or Apple — no separate registration step.
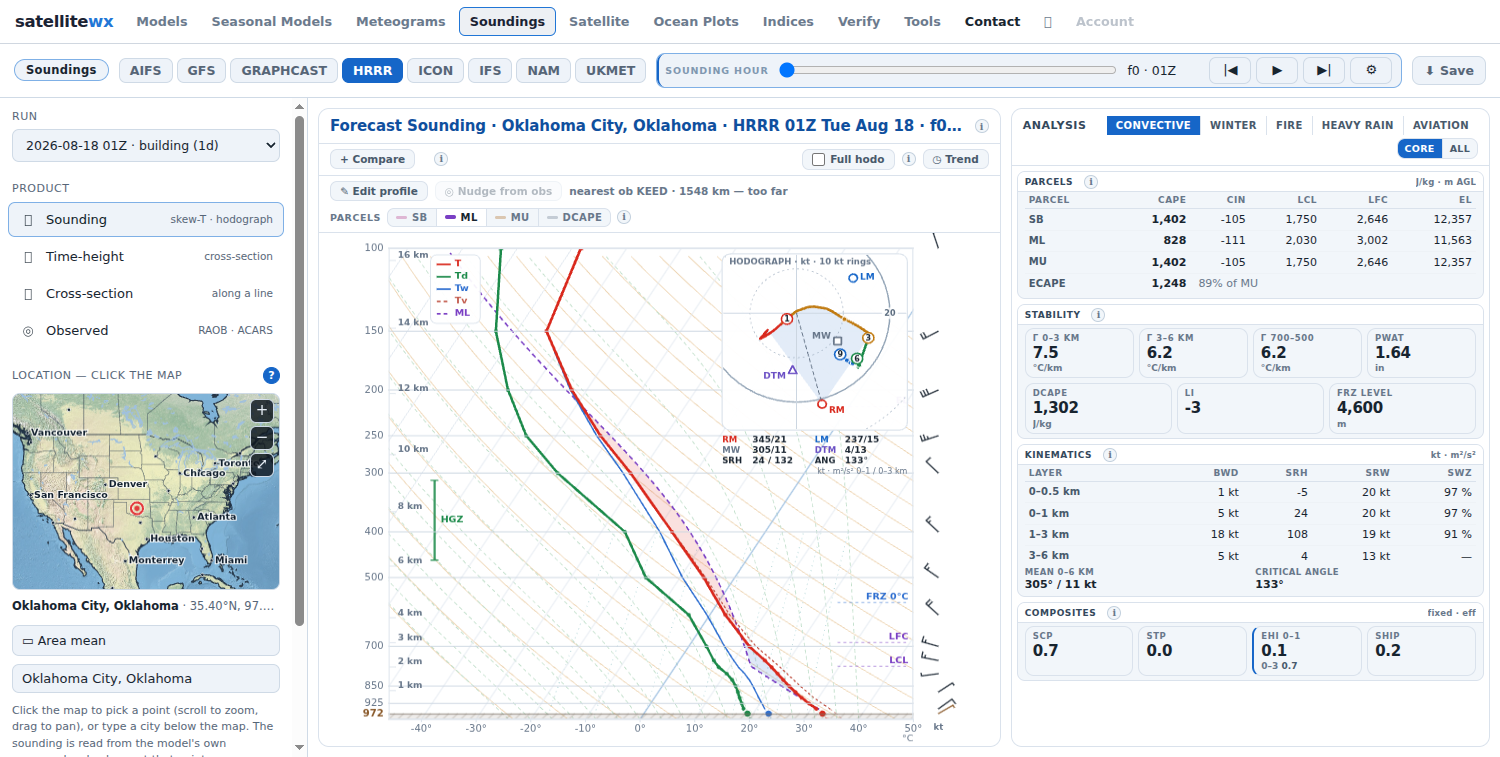
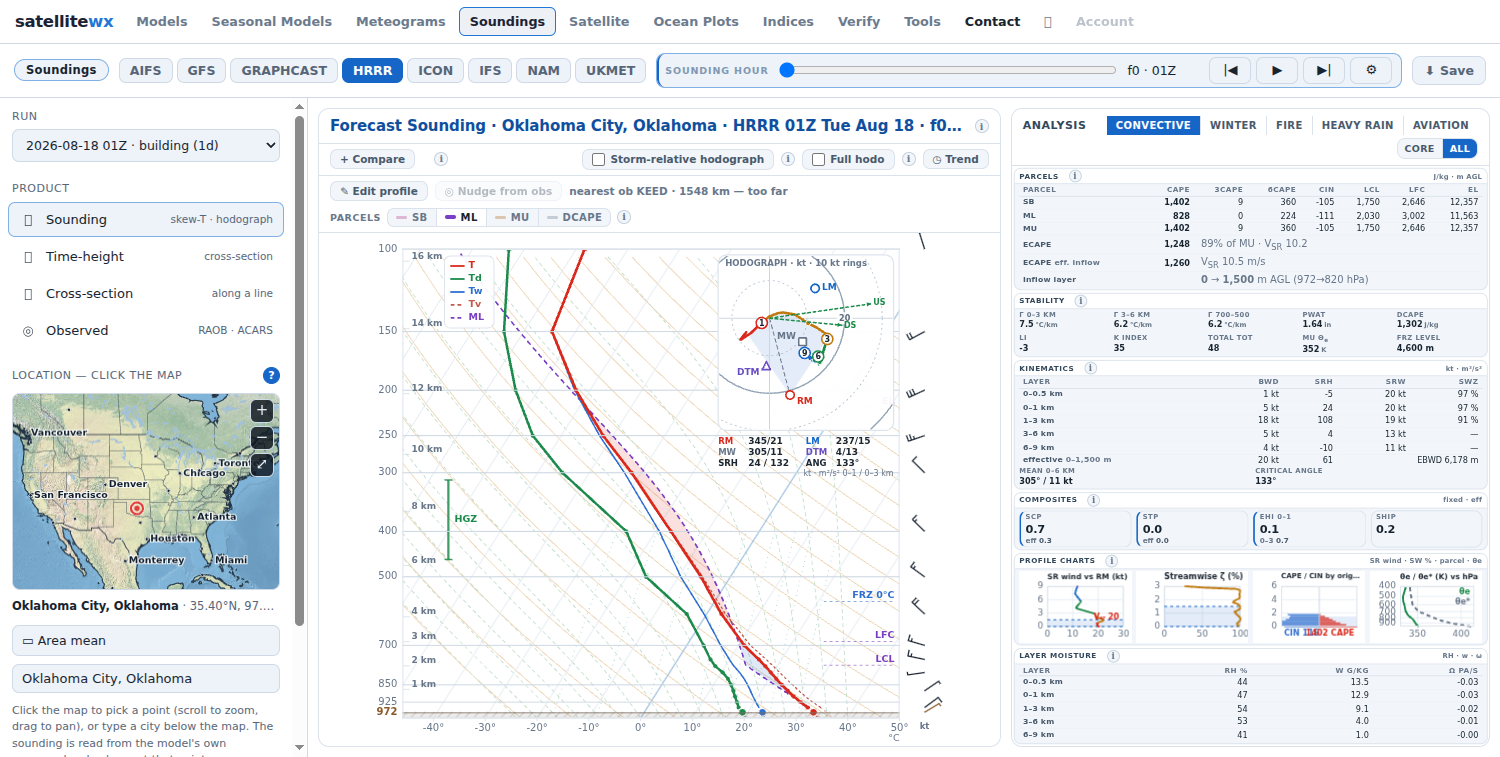
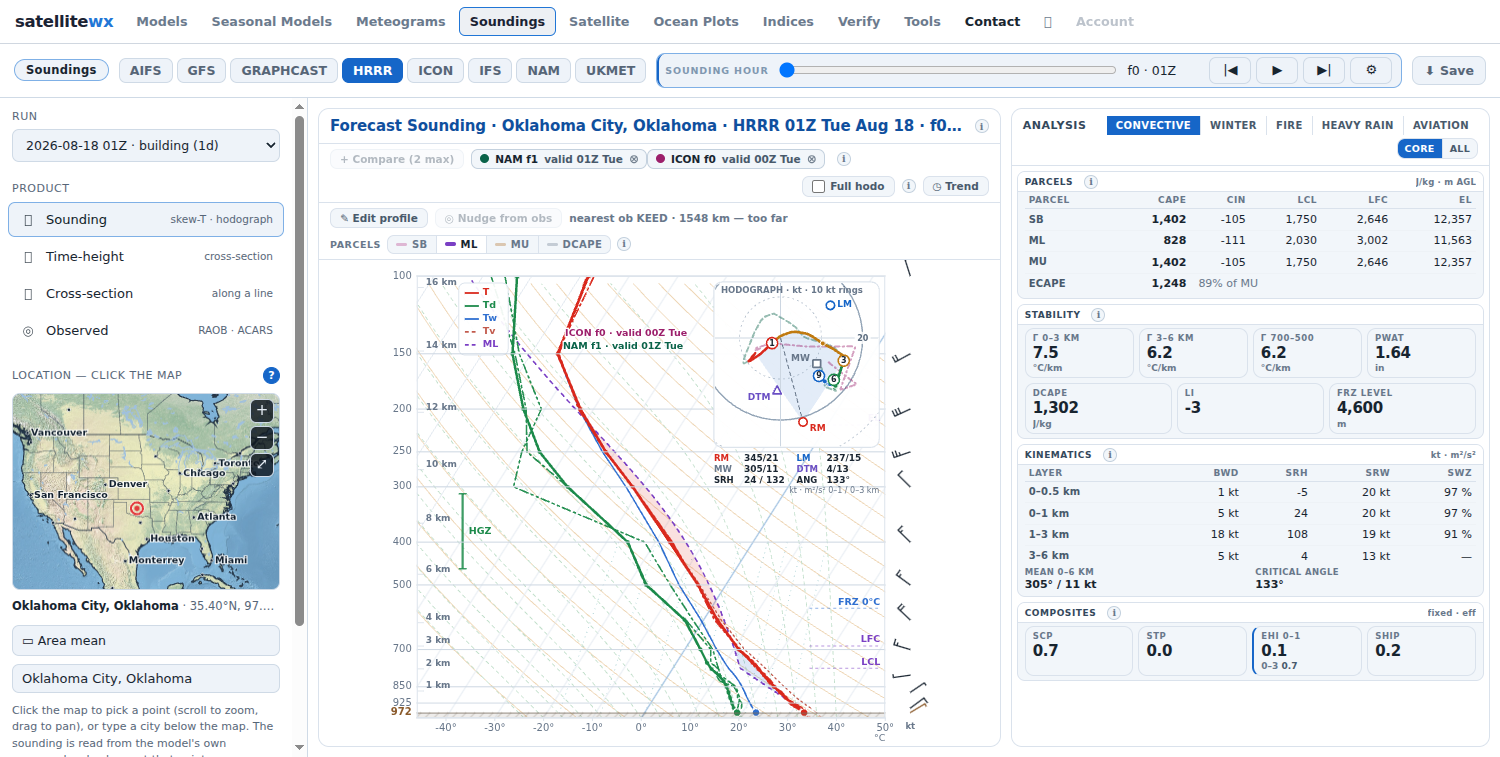
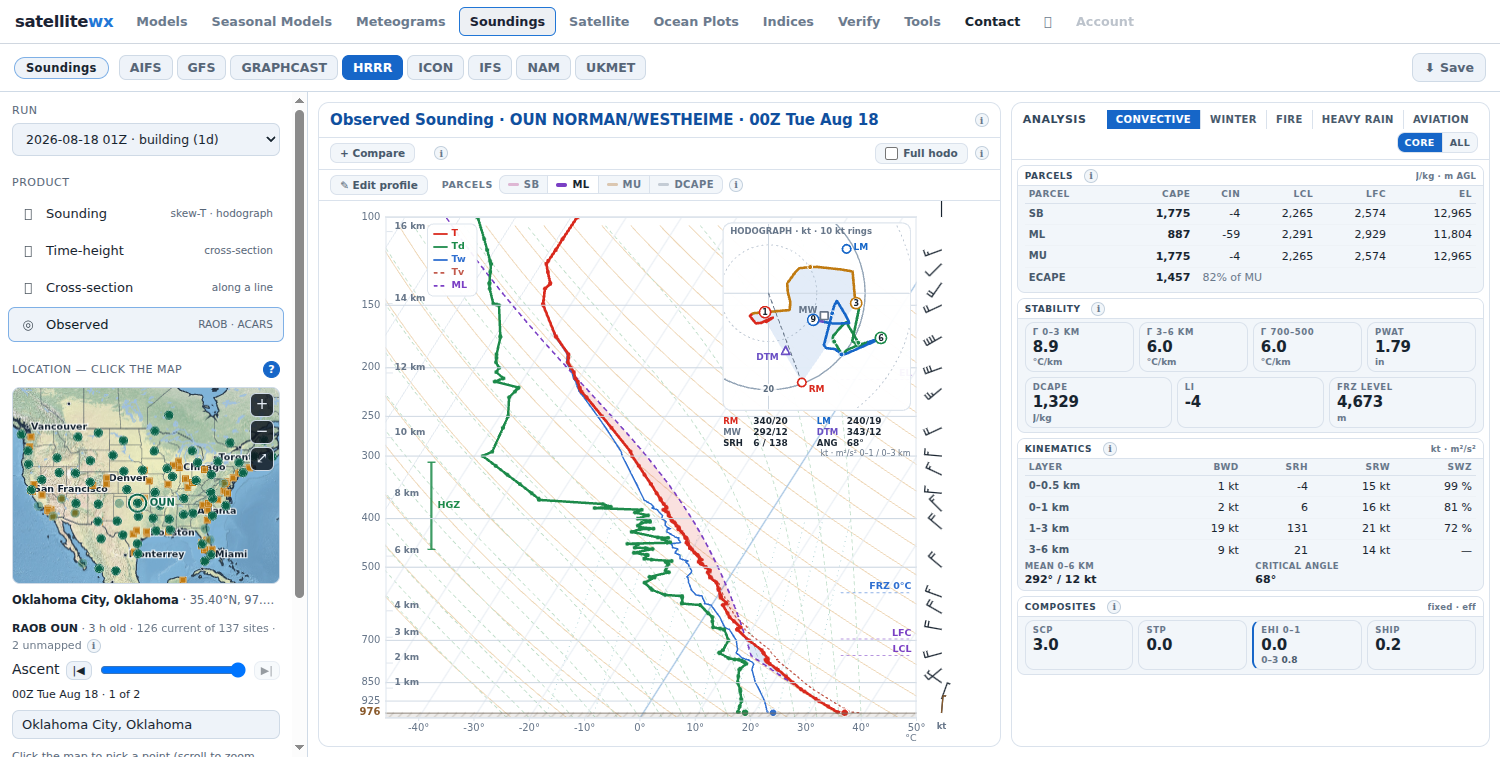
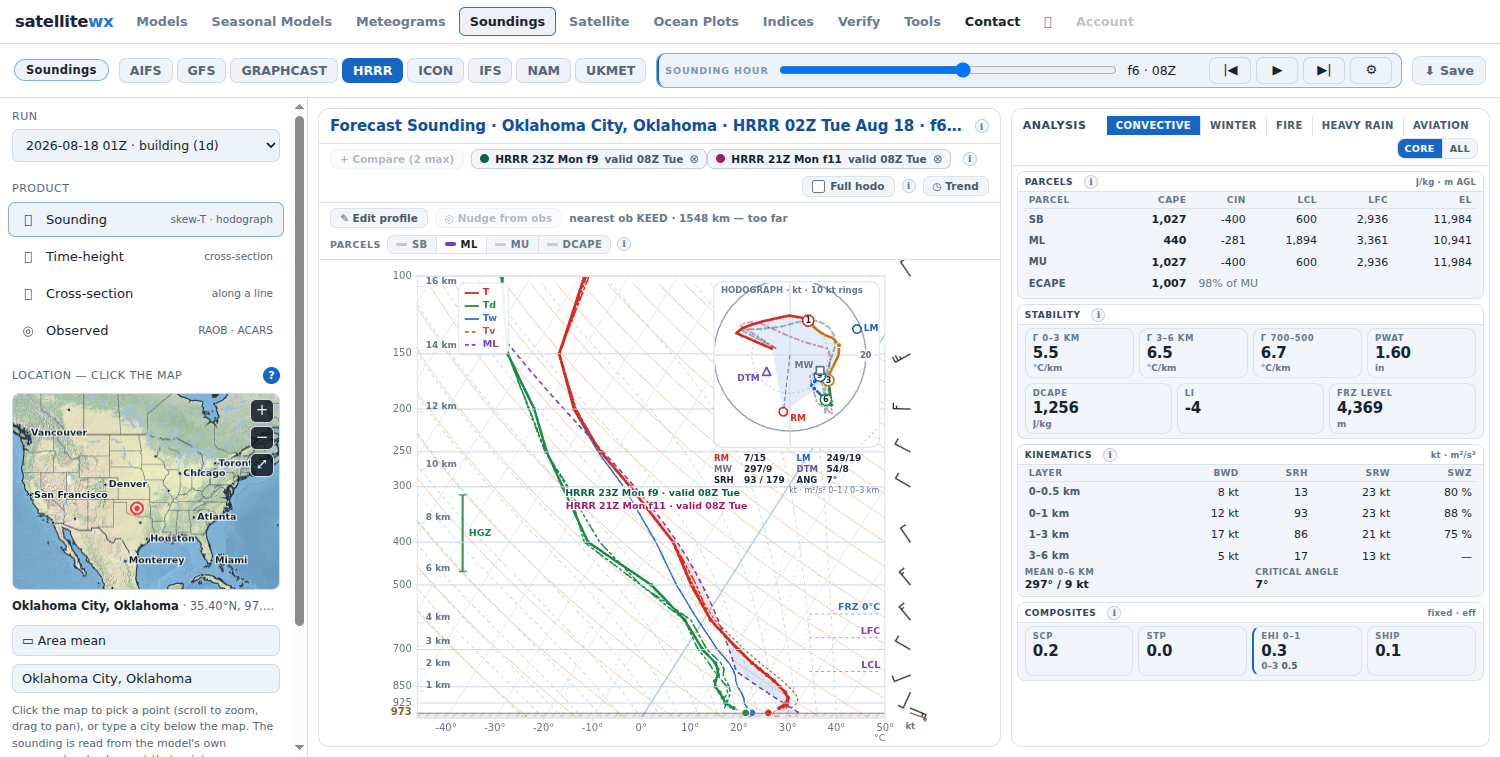
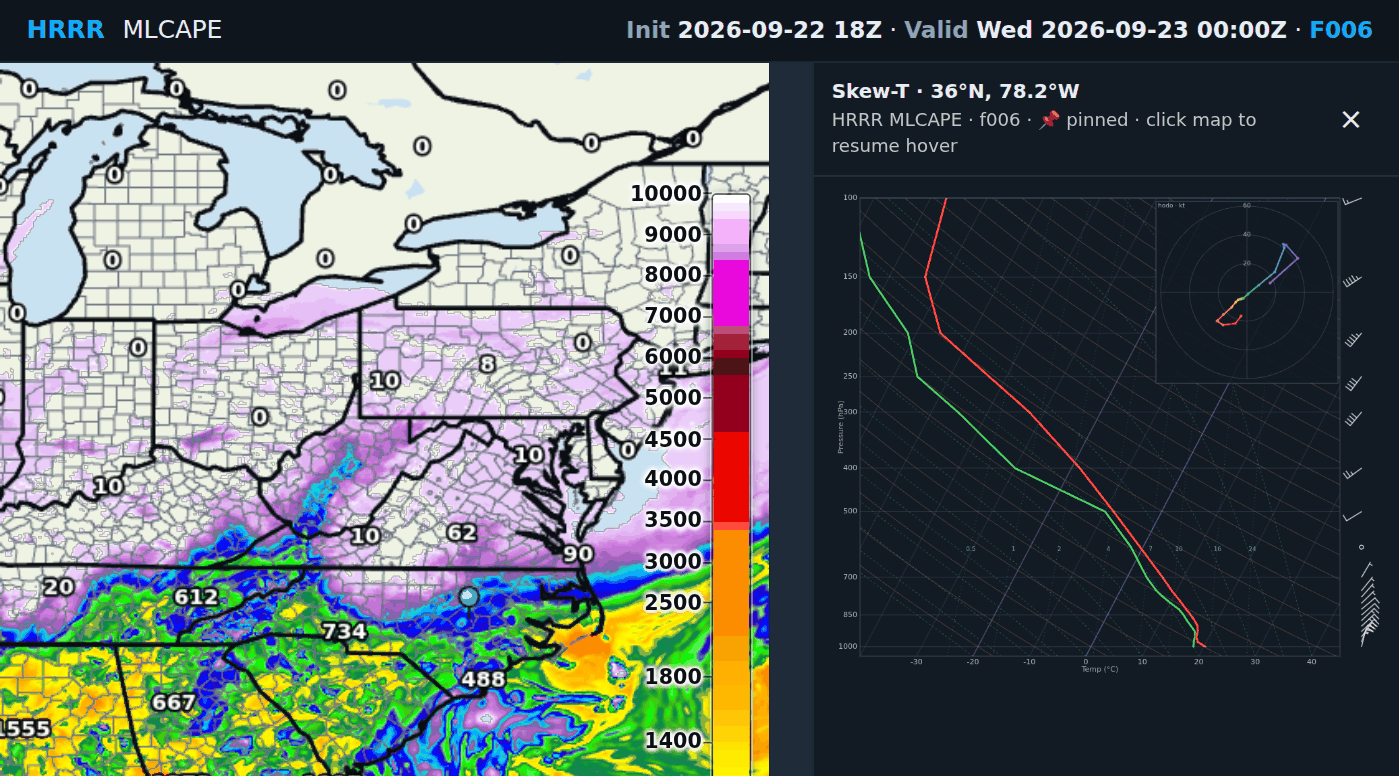
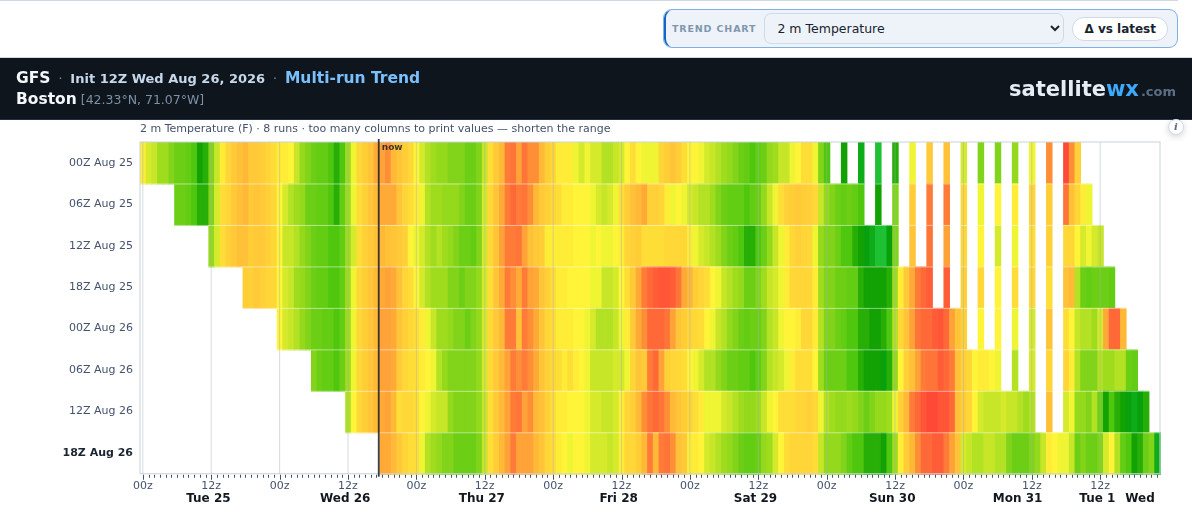
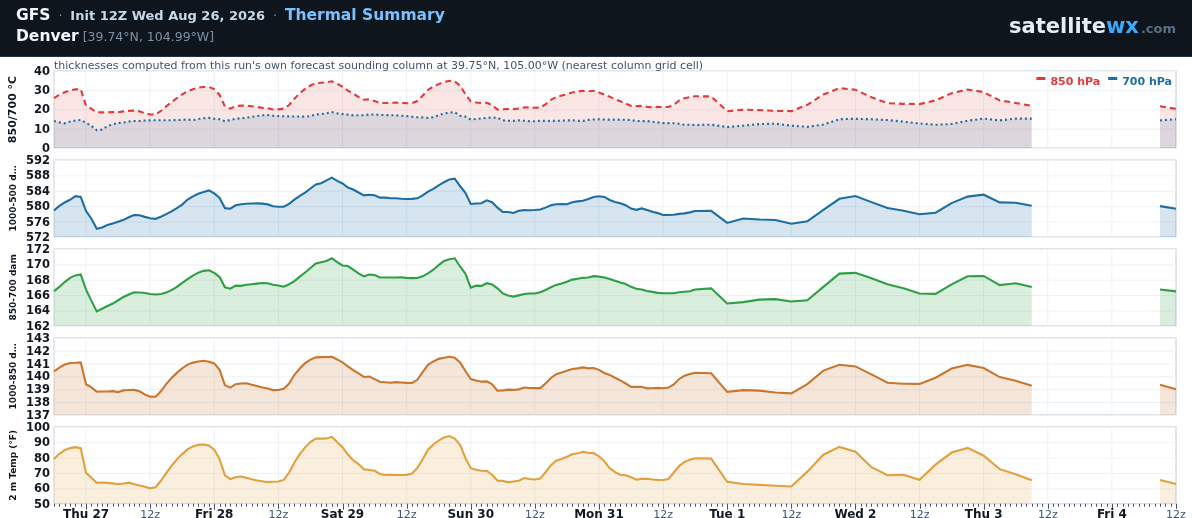
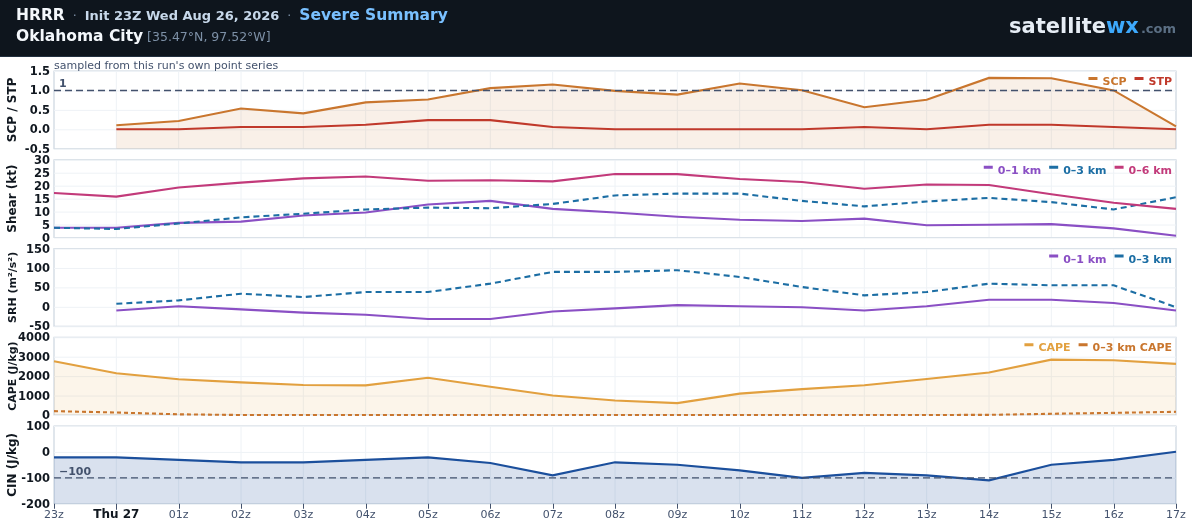
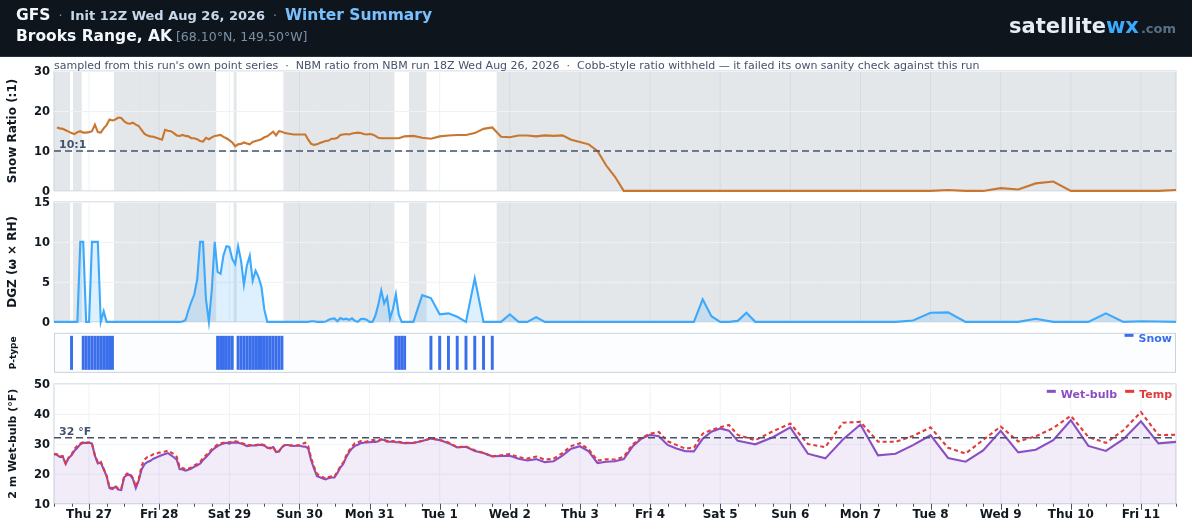
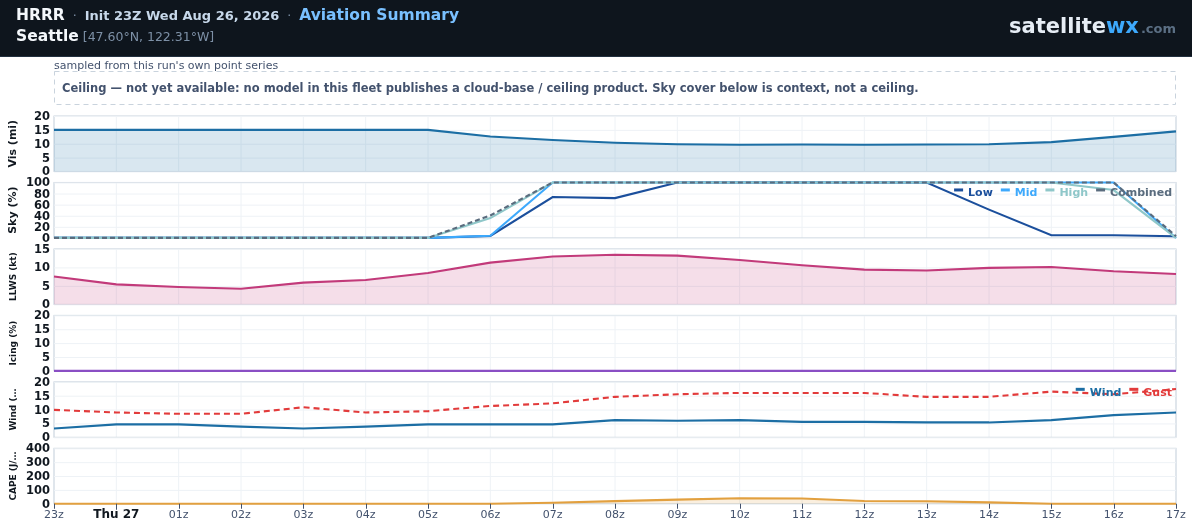
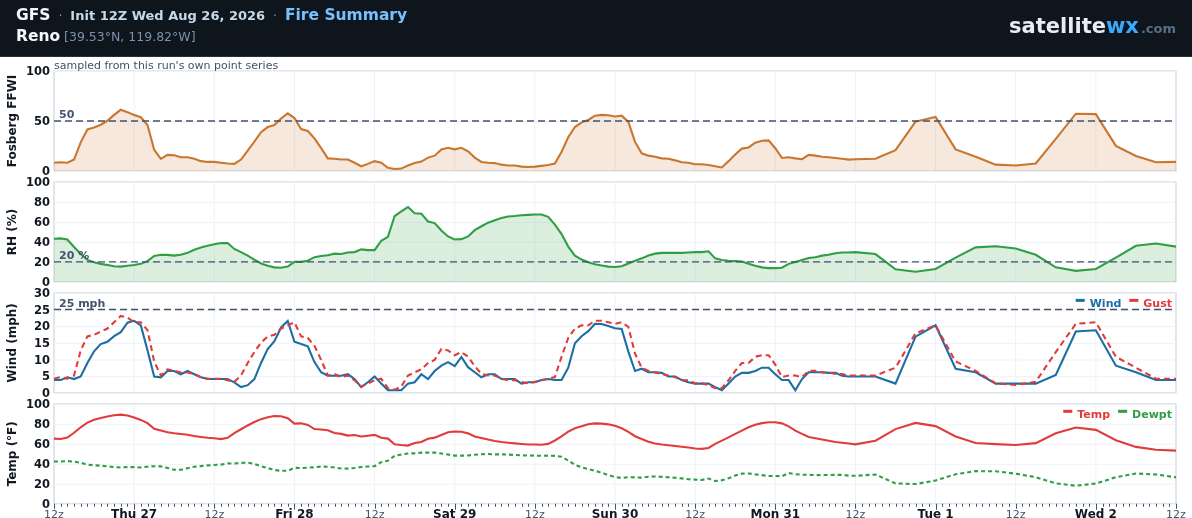
Click anywhere in North America and read the vertical profile from numerous models such as the HRRR, NAM, ECMWF's IFS and AIFS, ICON, UKMET, and more on the way. They include a full suite of parameters and the ability to filter by your interest such as severe, winter, fire, or aviation.
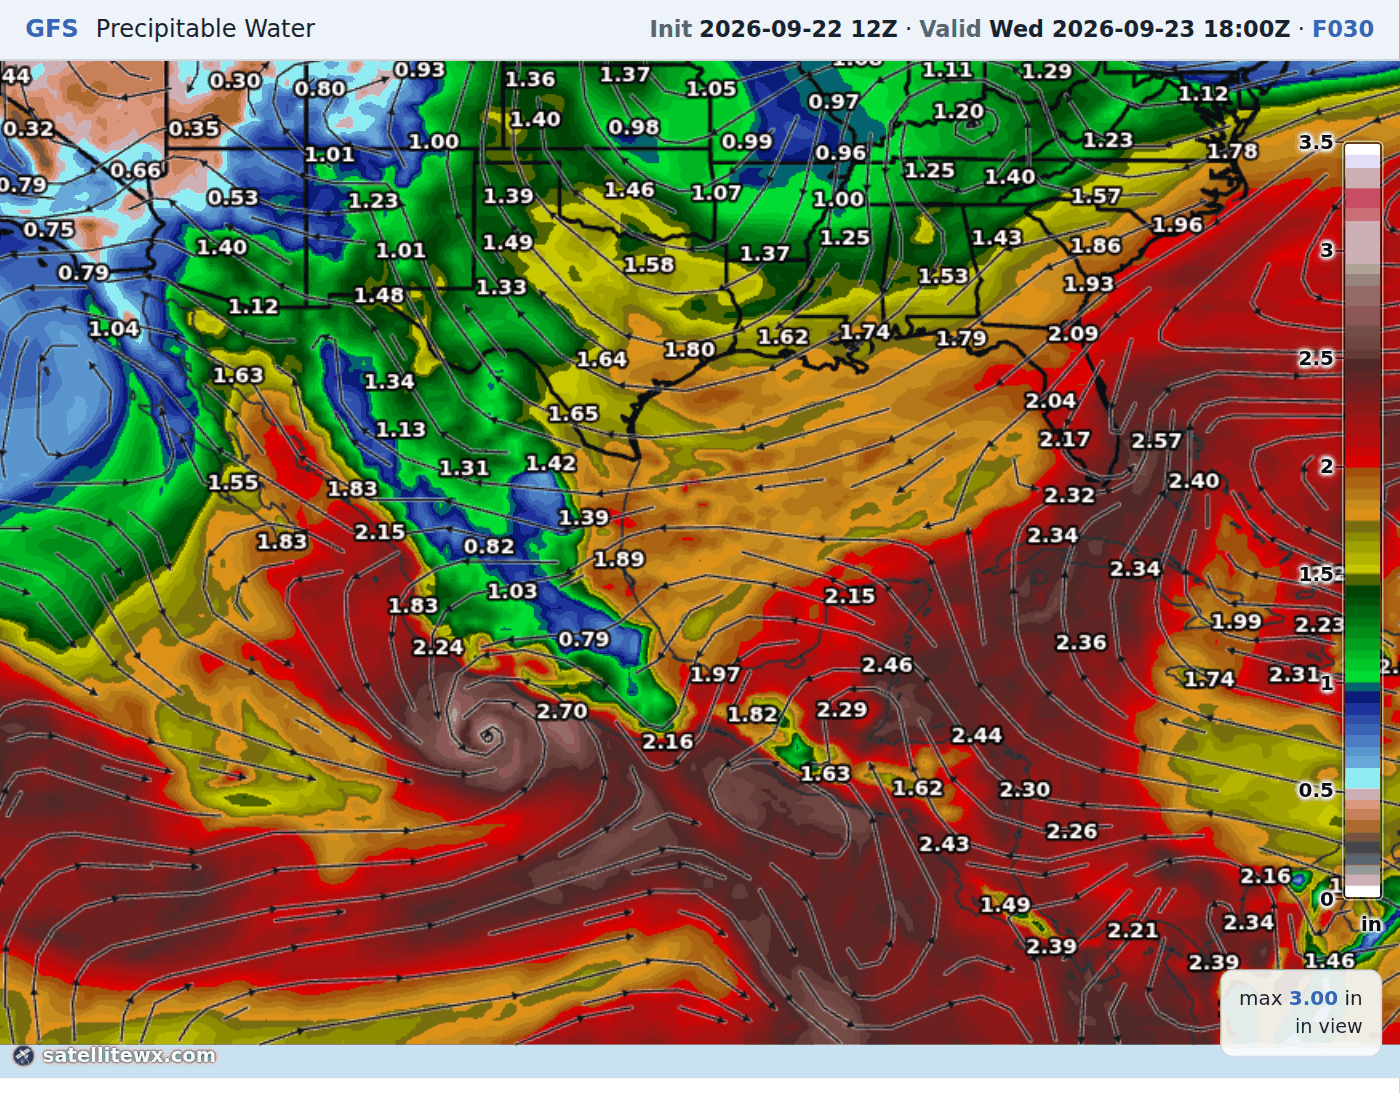
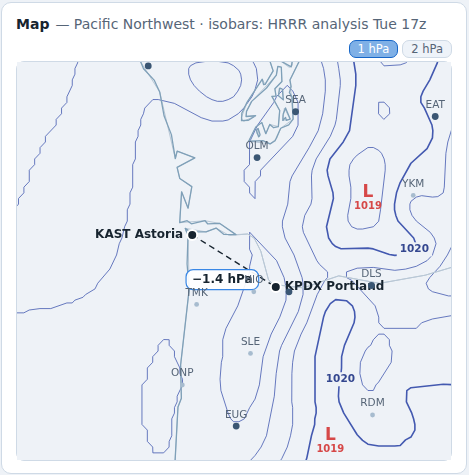
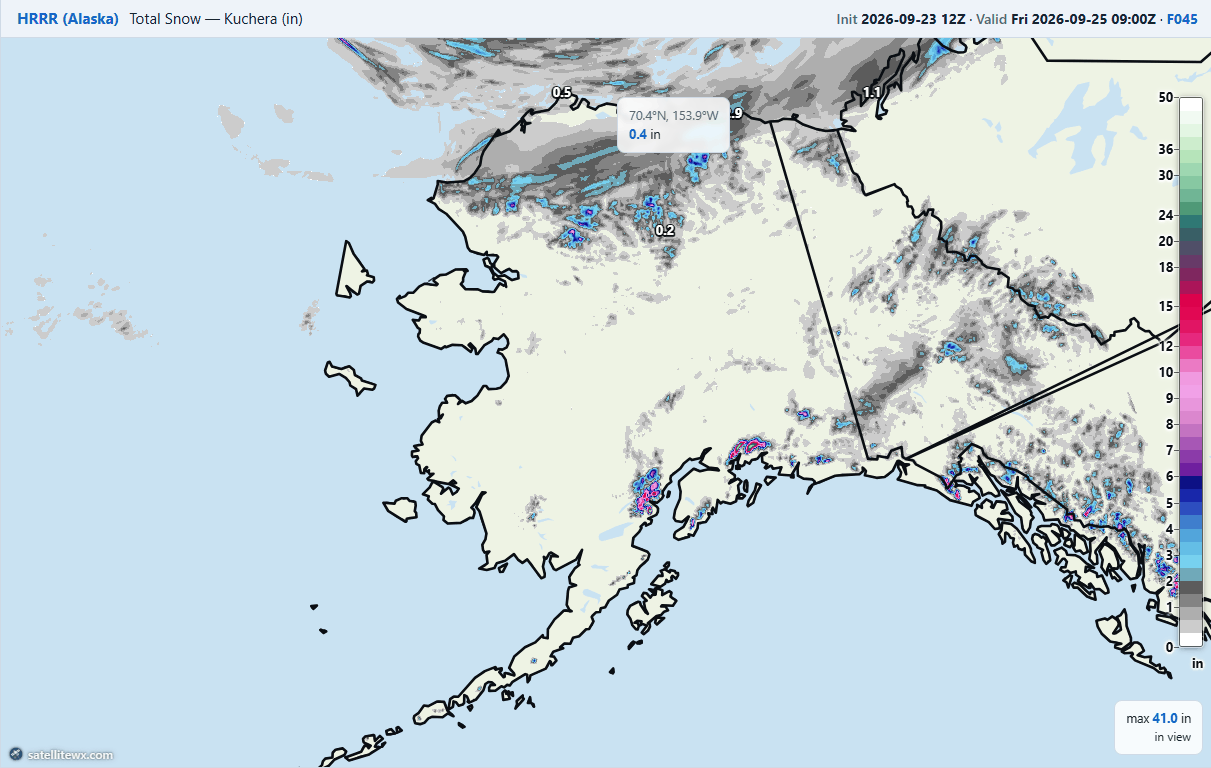
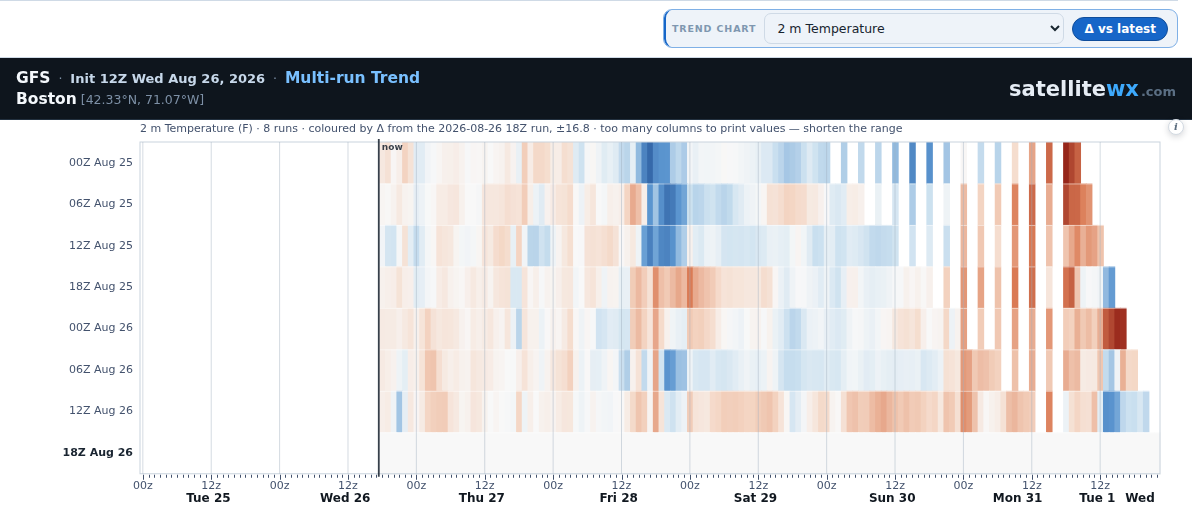
Hourly HRRR, plus NAM, GFS, ICON, IFS, AIFS, GraphCast and UKMET over North America, and HRRR/NAM Alaska nests. The roster is read live from what's actually published, so a stalled upstream feed drops out instead of serving stale profiles.
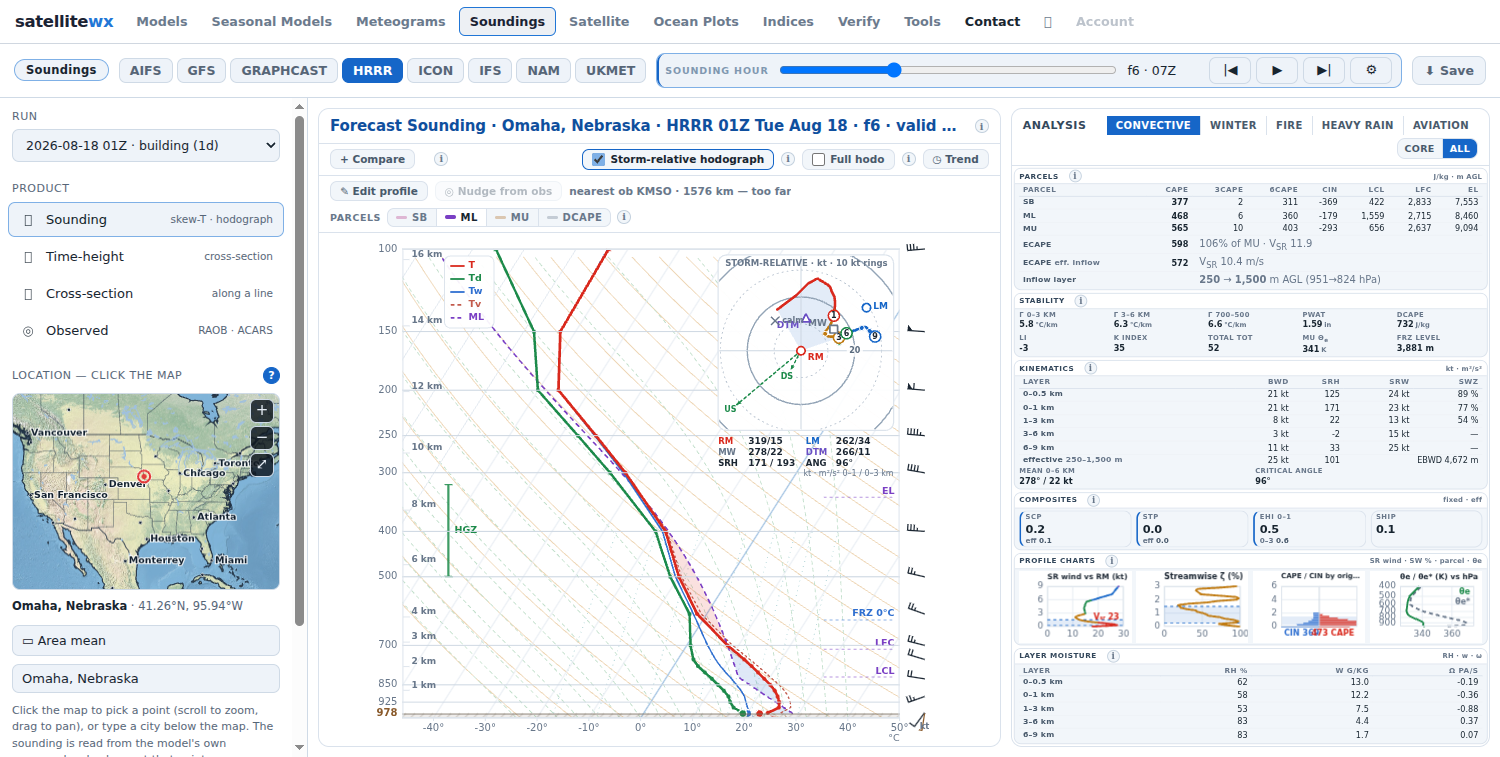
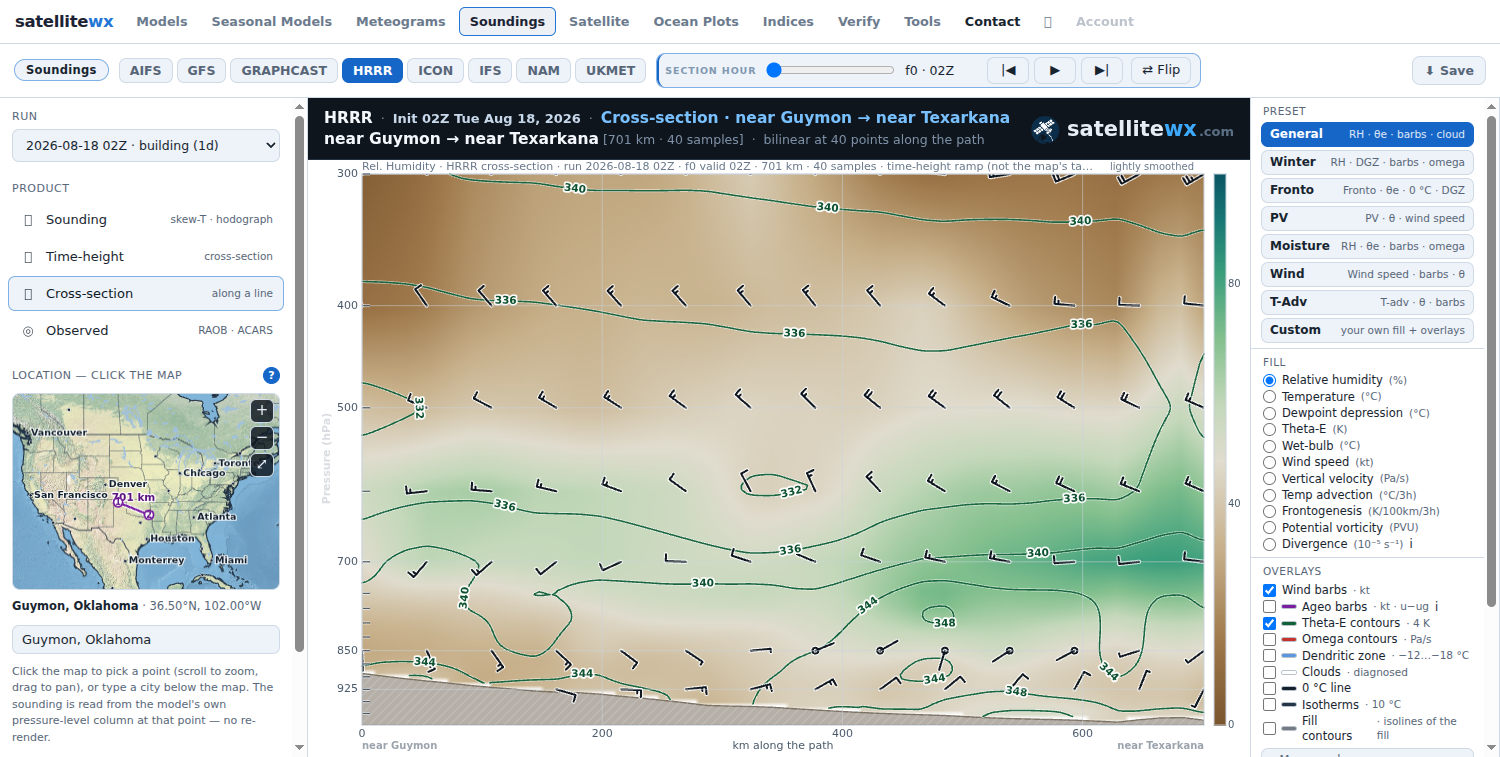
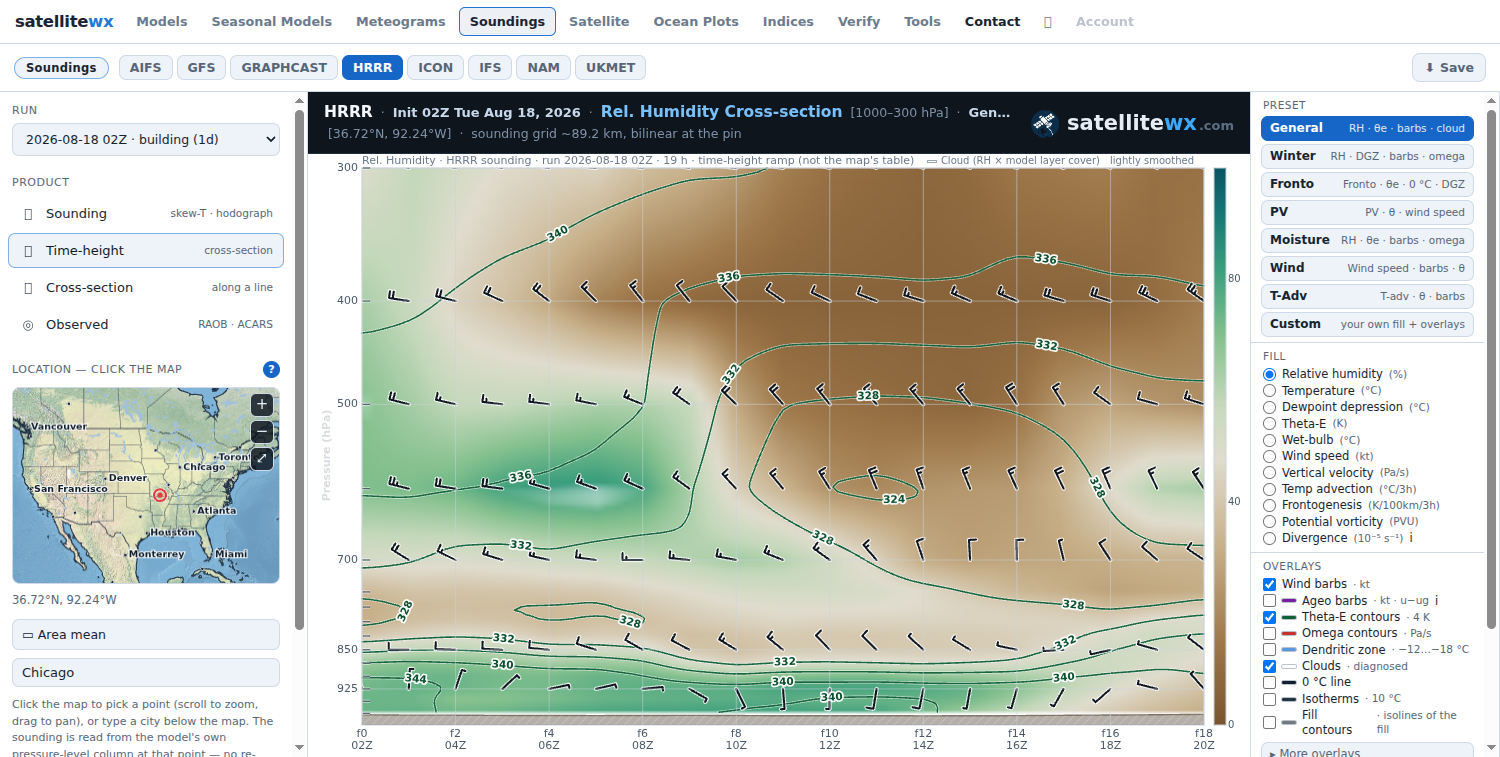
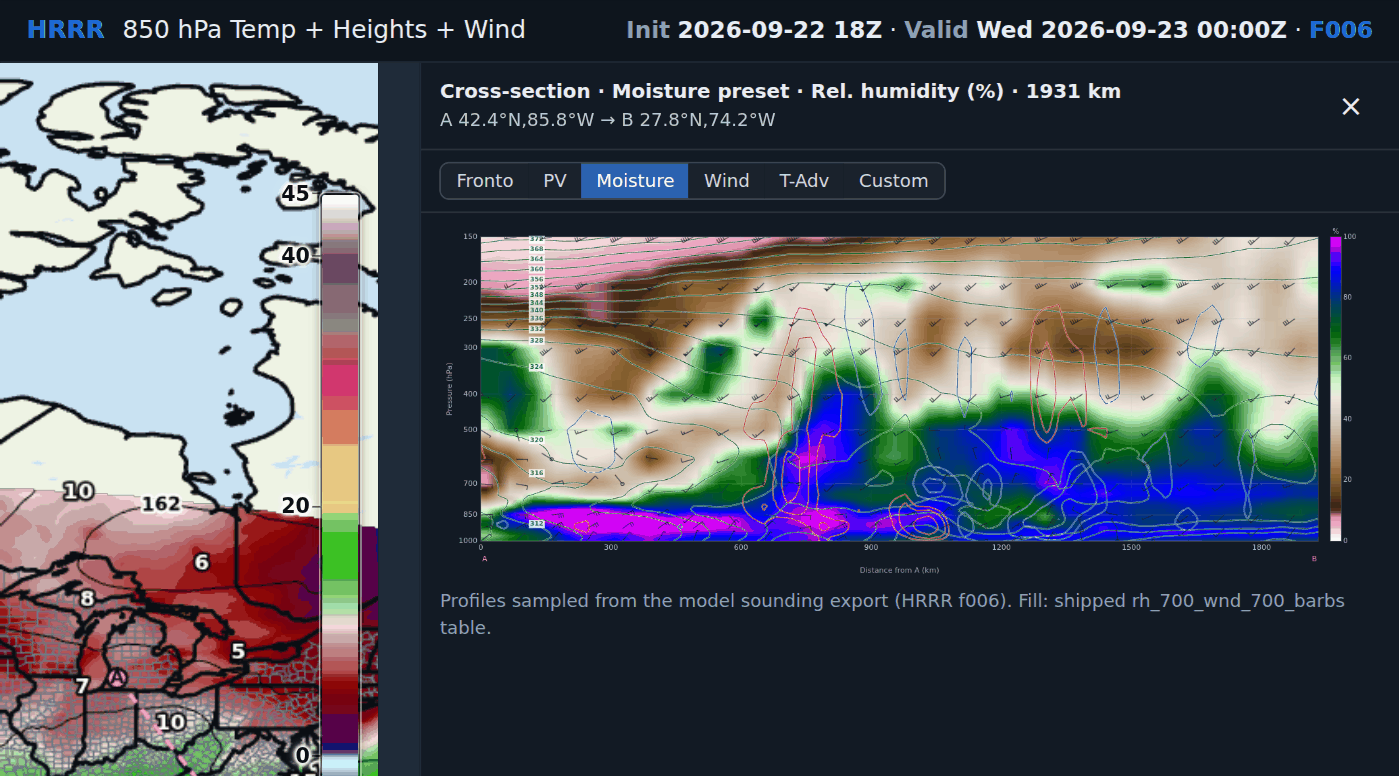
A click gives the profile at that point. Drag a box and every number becomes the mean over the grid points inside it. Click two ends for a cross-section along the line, or hold one point and take the section through time.
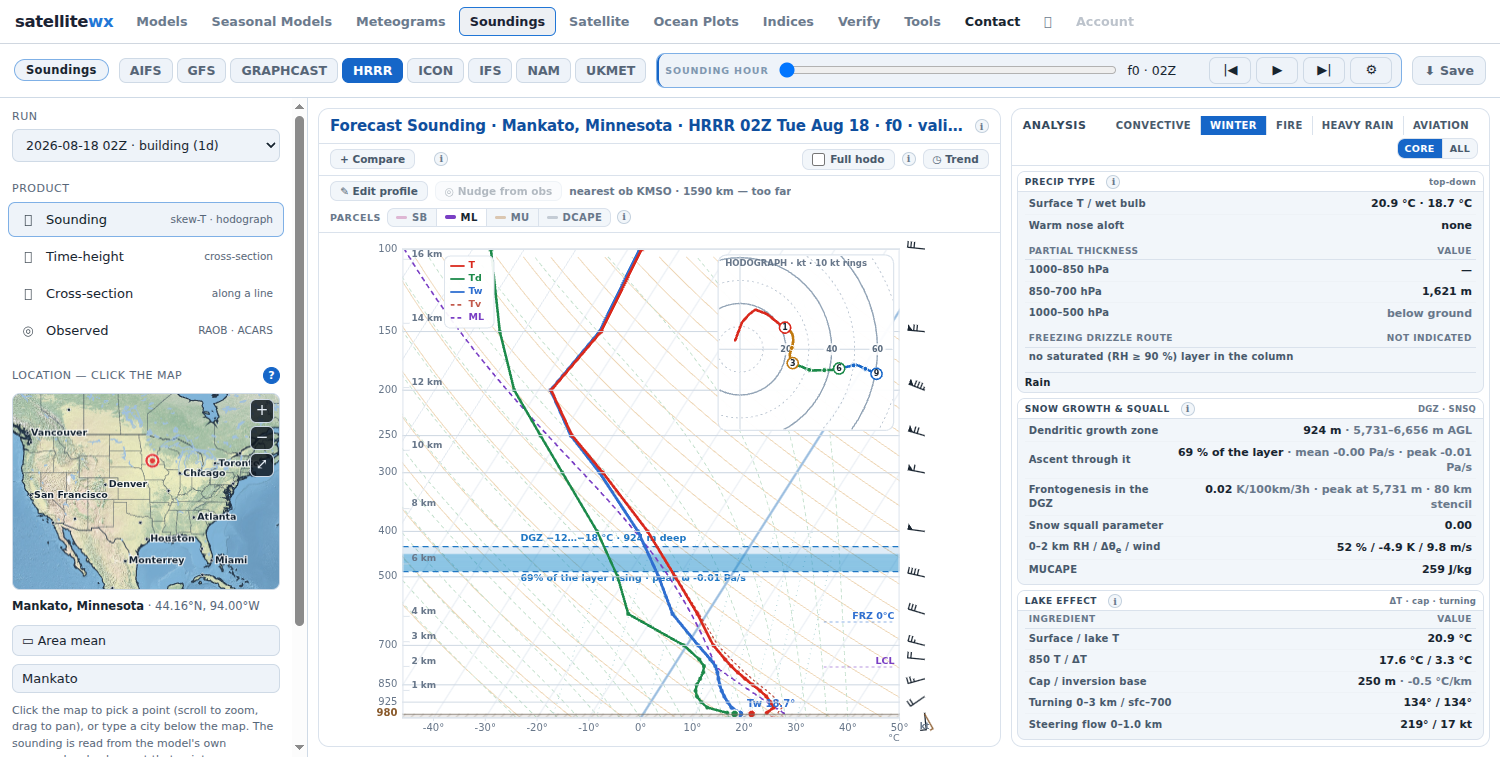
Convective, Winter, Fire, Heavy rain and Aviation — each shows only the quantities that answer its question, from snow growth and the freezing-drizzle route to icing, low-level wind shear and sub-cloud evaporation.
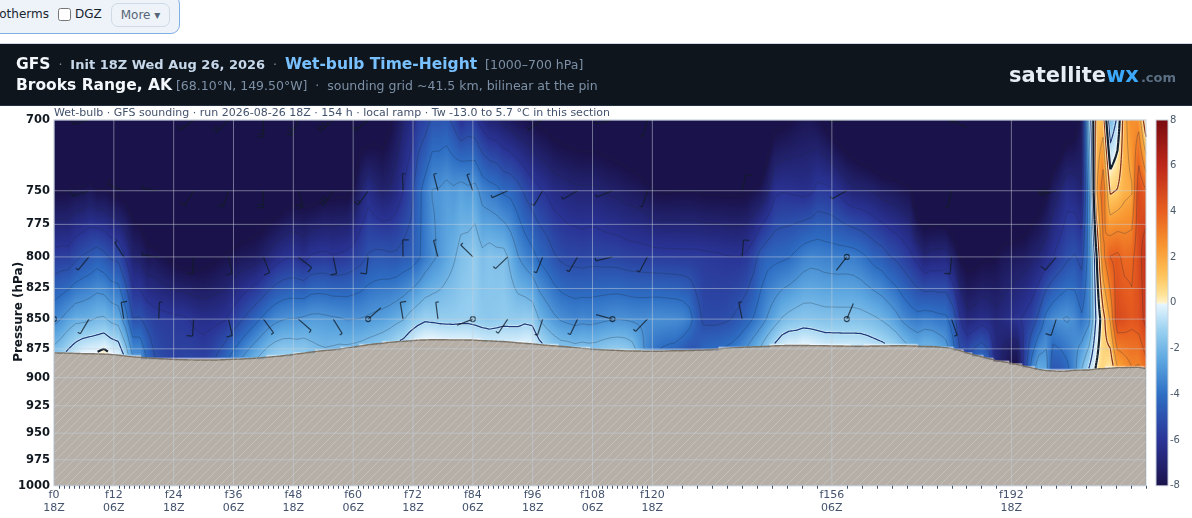
Eleven section fills — relative humidity, temperature, dewpoint depression, θe, wet-bulb, wind speed, vertical velocity, temperature advection, frontogenesis, potential vorticity, divergence — with overlays for wind and ageostrophic barbs, θe and omega contours, the dendritic zone, diagnosed cloud, the 0 °C line and isotherms. Seven presets, or build your own combination.
The map, the diagrams and the sections all zoom — sections re-fetch at finer resolution as you go in. Hovering reads out values under the cursor, and every table carries a small info button explaining what the numbers are and how they're computed.
Lift a parcel from any level you click, lift a whole layer by a chosen depth, or drag the temperature and dewpoint traces directly — every card, index and the hodograph recompute live.
Rawinsondes and aircraft profiles are shown as-is with their age stated.
Every run from the last 48 hours stays loadable and the run list refreshes itself every five minutes. Save exports the current diagram as a PNG.
HRRR and NAM cover the CONUS; GFS, IFS, AIFS, GraphCast, ICON and UKMET cover North America; two nests cover Alaska. Profiles are sampled from each model's own pressure-level output on a 0.5° mesh and drawn to 100 hPa — levels above that feed the stratosphere and index products instead. New forecast hours appear within seconds of the maps.
Soundings are open to everyone right now, no account needed.
Create a free account to save favorites and carry them across web, iOS and Android. Sign in with a magic-link email, Google, or Apple — no separate registration step.